Scope and sequence (F–10)
Learning programs to support implementation
Sequenced topics that could be used in teaching the Australian Curriculum Digital Technologies curriculum to address the content descriptions of the curriculum. The Scope and sequence has been updated to support teachers to implement AC:DT V9.0.
Select a topic across a two year cycle
Recommended any combination of three topics per year.
Choose a combination of units that suits your students and context.
Cycle one (Year 3)
Cycle one (Year 4)
Cycle one (Year 3)
| Jan | Jun | Dec | |||||||||
|---|---|---|---|---|---|---|---|---|---|---|---|
Cycle one (Year 4)
| Jan | Jun | Dec | |||||||||
|---|---|---|---|---|---|---|---|---|---|---|---|
Digital systems, safety and security
Overview
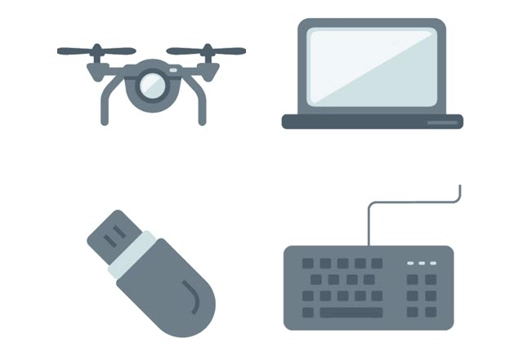
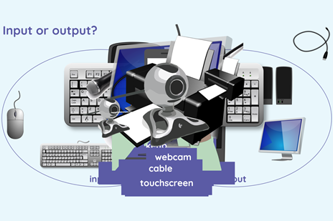
This unit explores peripherals of common digital systems and their function. Students investigate behaviours and protocols to stay safe online. Using a supported and guided approach introduce ways to collaborate and share content.
Achievement standards
By the end of Year 4, students securely access and use digital systems and their peripherals for a range of purposes, including transmitting data. They use the core features of common digital tools to plan, create, locate and share content, and to collaborate, following agreed behaviours. Students identify their personal data stored online and recognise the risks.
Australian Curriculum
Content descriptions
Digital systems AC9TDI4K01, AC9TDI4K02
Collaborating and managing AC9TDI4P06, AC9TDI4P07
Privacy and security AC9TDI4P08, AC9TDI4P09
Related content and General capabilities
Digital Literacy: Practising digital safety and wellbeing, Select and operate tools, Protect content, Managing and operating
Critical and Creative Thinking
This topic enables students to
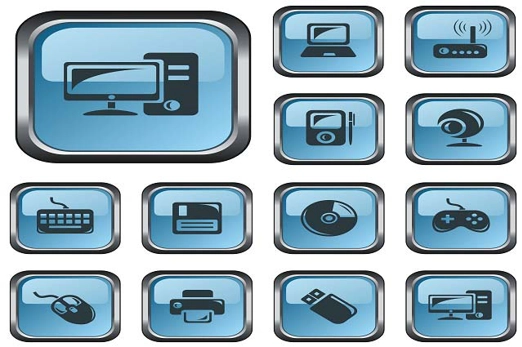
- explain that a digital system is made up of several parts that have a particular purpose
- identify peripherals
- identify and classify inputs and outputs
- describe the purpose of peripherals
- describe personal information that should be kept private online
- describe and follow behaviours and protocols to ensure they are safe online
- collaborate and share content following agreed behaviours.
Watch this video for a quick overview of the unit and how to use its resources with your students.
Assessment View assessment advice
Achievement standard
Digital Technologies: years 3–4
By the end of Year 4, students securely access and use digital systems and their peripherals for a range of purposes, including transmitting data. They use the core features of common digital tools to plan, create, locate and share content, and to collaborate, following agreed behaviours. Students identify their personal data stored online and recognise the risks.
Assessment tasks
Use this sample assessment task, Safety first when online, to assess students’ knowledge, skills and processes related to online safety, privacy and security.
Use these rubrics to assess students’ proficiency in:
- knowledge and use of digital systems: peripherals
- digital citizenship and online safety
- sharing content and collaborating online.
Rubric: Digital systems: peripherals
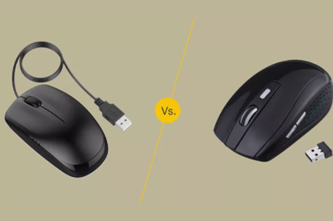
| Knowledge and use of digital systems: peripherals | with guidance, identifies parts of a digital system | identifies parts of a digital system and uses a suggested digital system with some guidance | identifies and describes parts of a digital system and their purpose, demonstrating appropriate use of peripherals including input and output | selects a digital system based on their needs, justifies their choice of digital system, and identifies how the peripherals are used and how data is transmitted; compares and contrasts the use of peripherals to do a similar job such as a wired and wireless mouse |
Rubric: Digital citizenship and online safety
| Digital citizenship and online safety | with guidance, identifies appropriate and potentially unsafe online behaviour | identifies appropriate and potentially unsafe online behaviour, and follows a set of rules or instructions that will minimise the risk posed by unsafe online behaviours | contributes to a co-created set of rules to stay safe online and minimise the risk posed by unsafe behaviours; identifies what information is personal and should not be shared online; applies their understanding of appropriate online behaviour to a variety of situations, such as fictional cyberbullying scenarios, to determine an appropriate course of action | identifies and encourages others to follow class rules to stay safe online; describes ways to be responsible while online and identifies what information is personal and should not be shared online and gives reasons why this is important, identifying the risks; evaluates the appropriateness of their behaviour and conduct online |
Rubric: Sharing content and collaborating online
| Sharing content and collaborating online | with help, shares content in a safe online environment; with some guidance shows limited awareness of version control and monitoring | shares content in a safe online environment and follows class rules; shows responsibility as a digital citizen; shows awareness of version control and with guidance may use it effectively | shares content safely online, collaborates as a team, and contributes effectively; contributes to co-created content following agreed class rules; shows understanding and effective use of version control for collaborative projects | shares content safely online, collaborates effectively, and contributes significantly; consistently follows class rules to be a responsible digital citizen; uses version control effectively, showing a high level of awareness and responsibility |
Unit sequence
This topic offers 3 sequential units
Unit 1
Digital systems and peripherals
Explore peripherals of common digital systems and their function.Unit 2
Using digital systems safely
Investigate behaviours and protocols to stay safe online.Unit 3
Collaborate and share content
Introduce ways to collaborate and share content using a supported and guided approach. Collaborating can include brainstorming ideas on a class topic, completing an online quiz in real time or creating a presentation collaboratively.Digital systems and peripherals
What is this about?
A desktop computer is an example of a digital system. A peripheral is typically external to a desktop computer and connected either via a wireless network or a cable. A digital system, such as a tablet, often has internal hardware components such as a camera, microphone and keyboard; however, on other digital systems these components might be considered peripherals because they need to be added to the digital system. Students may use tablets that perform multiple tasks such as recording video via internal camera and microphone, images with camera and entering text using a screen keyboard. Laptops may also have an in-built camera.
Content description
Explore and describe a range of digital systems and their peripherals for a variety of purposes AC9TDI4K01
Explore transmitting different types of data between digital systems AC9TDI4K02
Identify what personal data is stored and shared in their online accounts and discuss any associated risks AC9TDI4P09
This sequence enables students to:
- recognise that a digital device is made up of several parts
- identify peripherals
- identify input and output devices
- describe the purpose of peripherals.
Resources to include
Resources to introduce
-

How are digital photos and videos made?
Find out more -
Digital system cards
Find out more -
What are peripheral devices of a computer: definition, examples and types
Find out more


Years 3–4 How are digital photos and videos made?
Use this resource as a way to introduce digital devices and parts of digital systems such as peripherals.
Requires
- internet access
- computers, laptops or tablets; or a whiteboard to view the resource as a class
Suggested time
30 minutesEnables students to:
- identify common digital systems and their purpose
- identify input and output devices.
Years 3–4 Digital system cards
Use these two sets of printable cards for activities to support building knowledge and understanding of the key concept of digital systems with a focus on their components; in particular, hardware and peripherals.
Requires
- printed cards to cut out and classify
Suggested time
30 minutesEnables students to:
- identify peripherals
- identify input and output devices.
Years 3–4 What are peripheral devices of a computer: definition, examples and types
Use this video to discuss peripherals of digital devices connected to a desktop computer.
Requires
- internet access
- computers, laptops or tablets; or a whiteboard to view video as a class
Suggested time
5 minutesEnables students to:
- identify peripherals
- identify input and output
- describe the purpose of peripherals.

Resources to develop and consolidate learning
-
Peripherals
Find out more -
What parts make up a digital device?
Find out more -
Wired vs. wireless mice
Find out more
Years 3–4 Peripherals
In this sequence of lessons students explore different types of peripherals used every day in order to identify the data transmitted. A peripheral is an auxiliary device such as a computer mouse or keyboard that connects to and works with a device in some way.
Requires
- computers, laptops or tablets; or a whiteboard to view slides as a class
Suggested time
1 hourEnables students to:
- identify peripherals
- identify input and output
- describe the purpose of peripherals.
Years 3–4 What parts make up a digital device?
In this lesson students develop an understanding of the relationship between inputs, processes and outputs and apply it to devices that they will be familiar with from their everyday surroundings.
Requires
- computer or laptop and electronic whiteboard to share slides
- slides Input output devices
Suggested time
1 hourEnables students to:
- identify peripherals
- identify input and output
- describe the purpose of peripherals.

Years 3–4 Wired vs. wireless mice
Use this resource to explore the advantages and disadvantages of wireless and wired mice.
Requires
- printed or electronic version of the article or both with computers, laptops or tablets if needed
Suggested time
30 minutesEnables students to:
- identify peripherals
- describe the purpose of peripherals
- evaluate use of wired and wireless devices.

Resources to extend and integrate learning
-
Peripherals family task
Find out more -
Can AI guess your emotion?
Find out more -
Makey Makey projects for years 3–6
Find out more


Years 3–4 Peripherals family task
Provide this Take home task designed for your students to explore some commonly used peripherals around their home.
Requires
- printed or electronic version of the slides
Suggested time
1 hourEnables students to:
- identify peripherals
- identify input and output
- describe the purpose of peripherals.

Years 3–4 Can AI guess your emotion?
Use this lesson that explores an artificial intelligence (AI) tool that recognises objects to use digital systems with peripherals for a purpose, and transmit different types of data.
Requires
- internet access
- computers, laptops or tablets with a webcam or digital camera
- access to Teachable machine
Suggested time
1 hourEnables students to:
- train an AI to recognise objects via the webcam
- identify peripherals
- identify input and output
- describe the purpose of peripherals.

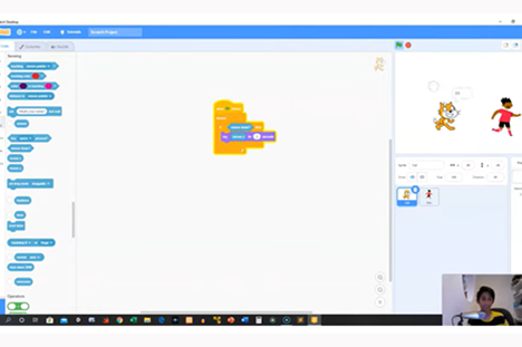
Years 3–4 Makey Makey projects for years 3–6
Make use of these lesson ideas that show how to explore the use of Makey Makey as an input device that replaces keyboard functions.
Requires
- computers, laptops or tablets
- access to Makey Makey board
- access to Scratch 3.0
Suggested time
1 hourEnables students to:
- use an input device to operate a Scratch game
- identify peripherals
- identify input and output
- describe the purpose of peripherals.
Further reading and professional learning

Years 3–4 Classroom ideas: years 3–4 – understanding digital systems
This resource gives ideas and inquiry questions for teaching about digital systems.
Suggested time
30 minutes
Using digital systems safely
What is this about?
Technologies are an embedded part of our lives, and it is essential that students understand how to engage responsibly in online spaces. Using the school's (Digital Literacies/ICT) agreement as a focus, develop an agreed set of rules and discuss protocols for digital technologies use. It is important students understand what it means to behave safely online and have an opportunity to explore this in more detail. Discuss the use of personal information or images when communicating online. Empower students with the knowledge of how to act responsibly online and equip them with the tools to know how to deal with cyberbullying behaviour. Use a collaborative online project to apply protocols and manage a task.
Content descriptions
Explore and describe a range of digital systems and their peripherals for a variety of purposes AC9TDI4K01
Explore transmitting different types of data between digital systems AC9TDI4K02
Identify what personal data is stored and shared in their online accounts and discuss any associated risks AC9TDI4P09
This sequence enables students to:
- describe the types of content available on the internet
- describe potential dangers while using the internet
- describe personal information that should be kept private and not shared online
- describe behaviours and protocols to ensure their safety online.
Resources to include
Resources to introduce
-
What is digital publishing?
Find out more -
What are digital communication systems?
Find out more -
How can we be respectful and responsible online?
Find out more -
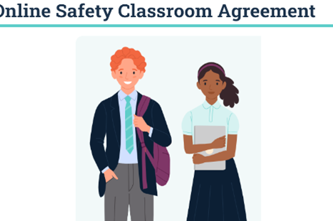
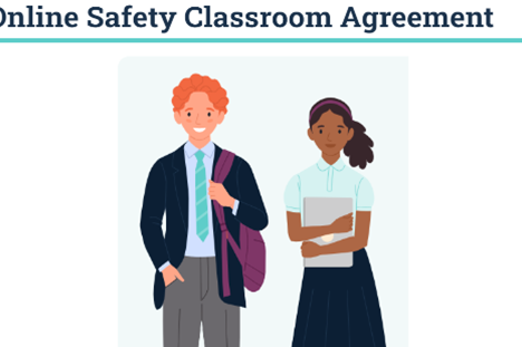
Online Safety Classroom Agreement
Find out more -
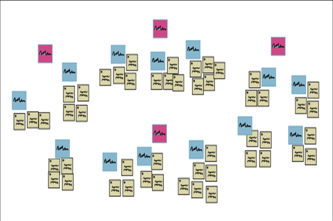
Agreeing to an ICT agreement
Find out more -
eSafety First Nations: Connecting safely
Find out more


Years 3–4 What is digital publishing?
Use this resource to discuss the internet and the resources that can be found via the internet.
Requires
- internet access
- computers, laptops or tablets; or a whiteboard to view resource as a class
Suggested time
30 minutesEnables students to:
- describe the types of content available on the internet
- describe some dangers while using the internet.

Years 3–4 What are digital communication systems?
Use this resource to discuss ways we communicate online and responsible online behaviours. Note the resource contains a video that is not accessible in our region.
Requires
- internet access
- computers, laptops or tablets; or a whiteboard to view resource as a class
Suggested time
30 minutesEnables students to:
- describe the types of content available on the internet
- describe potential dangers while using the internet.

Years 3–4 How can we be respectful and responsible online?
Use this resource to discuss ways to behave online as a precursor to co creating an Online Safety Classroom Agreement with your students.
Requires
- internet access
- computers, laptops or tablets; or teacher laptop and whiteboard to view resource as a class
Suggested time
30 minutesEnables students to:
- describe ways to be respectful and responsible online
- describe potential dangers while online.

Years 3–4 Online Safety Classroom Agreement
Use this resource to co-create an Online Safety Classroom Agreement with your students that defines, highlights and encourages safe and respectful online behaviours.
Requires
- internet access, teacher laptop connected to whiteboard to view resource as a class
- downloaded and printed agreement
Suggested time
1 hourEnables students to:
- describe ways to be respectful and responsible online
- describe the 'esafe' approach that aims to create an online environment that is safe, supportive and inclusive.
Years 3–4 Agreeing to an ICT agreement
Use this resource that includes a practical activity to support the co creation of an Online Safety Classroom Agreement with your students.
Requires
- internet access, teacher laptop connected to whiteboard to view online brainstorming software as a class; or use sticky notes
Suggested time
1 hourEnables students to:
- describe ways to be respectful and responsible online
- describe elements of an agreement that the class should follow.
Years 3–4 eSafety First Nations: Connecting safely
Guidance and tips about staying safe online for First Nations students.
Requires
- internet access
- computers, laptops or tablets
Suggested time
1-2 hoursEnables students to:
- identify ways to stay safe online that protects First Nations peoples’ identity, culture and connections.

Resources to develop and consolidate learning
-
What are digital footprints?
Find out more -
Making good choices online
Find out more -
Be secure
Find out more

Years 3–4 What are digital footprints?
Use this resource to discuss the digital trail left as you explore the internet. An understanding of digital footprints is an expectation for students at years 5–6.
Requires
- internet access
- computers, laptops or tablets; or a whiteboard to view resource as a class
Suggested time
30 minutesEnables students to:
- describe the types of content available on the internet
- describe some dangers while using the internet
- identify what personal data is stored and shared as they explore online content.
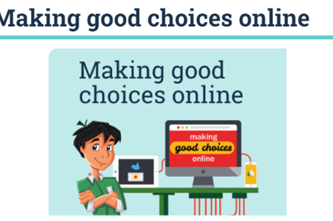
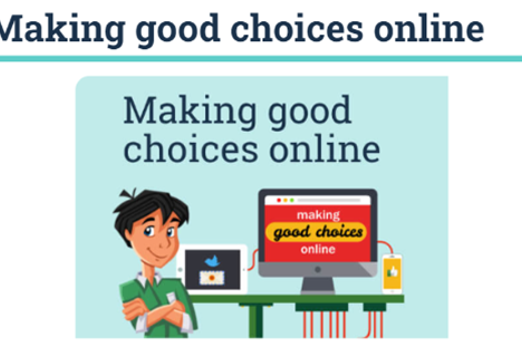
Years 3–4 Making good choices online
This lesson explores three different scenarios asking students to decide what the character should do in each online situation using the think, evaluate, choose (TEC) model.
Requires
- internet access
- computers, laptops or tablets
- electronic whiteboard to view slides as a class
Suggested time
30 minutesEnables students to:
- describe ways to be responsible user in an online environment
- understand the need to discuss choices with a trusted adult.
Years 3–4 Be secure
Use these resources to explore ways to be secure online. The video is 5:50 minutes long. Each activity in the lesson plan is designed to take a minimum of 30 minutes.
Requires
- internet access
- computers, laptops or tablets
Suggested time
30 minutesEnables students to:
- identify problematic situations that may impact their online safety or security
- describe ways to stay safe online.
Resources to apply and extend learning
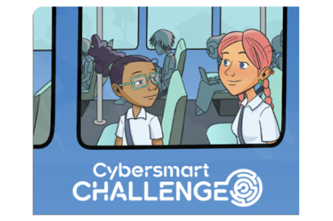
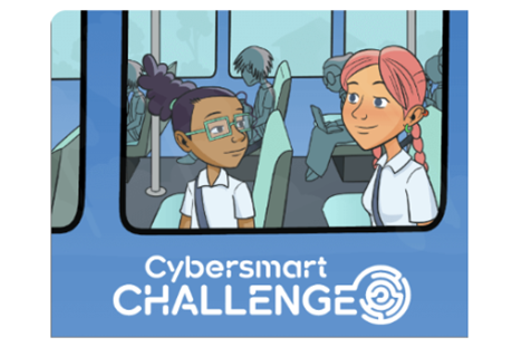
Years 3–4 Cybersmart challenge
These teacher-led activities use animated videos to introduce students to key online safety issues including cyberbullying, protecting personal information and sharing images.
Requires
- internet access
- computers, laptops or tablets; or a whiteboard to view resource as a class
- printable worksheets and slides
Suggested time
1-3 hoursEnables students to:
- identify problematic situations that may impact their online safety or security
- describe ways to stay safe online.
Further reading and professional learning
-
Protecting your personally identifiable information
Find out more -
Curriculum connection: Online safety
Find out more -
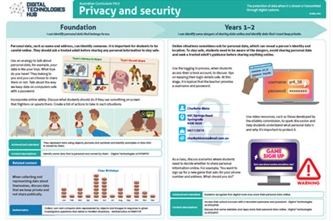
Privacy and security infographic (F-10)
Find out more


Years 3–4 Protecting your personally identifiable information
This website provides the key information about being safe online.
Suggested time
30 minutes
Years 3–4 Curriculum connection: Online safety
Refer to this ACARA resource to learn more about connections to the curriculum related to online safety.
Suggested time
30 minutes
Years 3–4 Privacy and security infographic (F-10)
Explore privacy and security for your Year band.
Suggested time
30 mins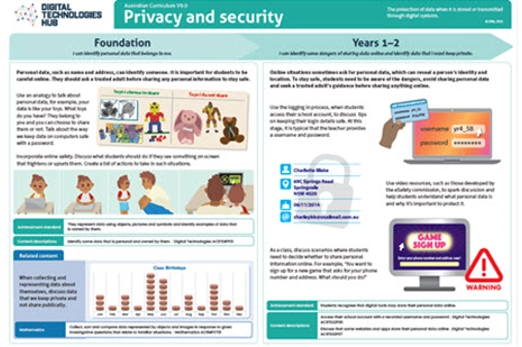
Collaborate and share content
What is this about?
Introduce ways to collaborate and share content using a supported and guided approach. Choose a focus to collaborate such as brainstorming ideas on a class topic, completing an online quiz in real time or creating a presentation collaboratively. When students collaborate as a team they will require a shared space such as a place for an online document to enable group members to contribute and have access to the most up-to-date version. Depending on your school, common platforms that enable online collaboration include Google Workspace for Education, Microsoft 365 or Apple products such as Keynote. As students use these types of platforms, they follow agreed protocols related to digital etiquette, privacy and safety.
Content descriptions
Use the core features of common digital tools to create, locate and communicate content, following agreed conventions AC9TDI4P06
Use the core features of common digital tools to share content, plan tasks, and collaborate, following agreed behaviours, supported by trusted adults AC9TDI4P07
Access their school account using a memorised password and explain why it should be easy to remember, but hard for others to guess AC9TDI4P08
This sequence enables students to:
- describe safe ways to share content in a trusted space
- describe potential dangers while using the internet
- describe personal information that should be kept private and not shared online
- describe behaviours and protocols to ensure effective work practices while sharing content online and their safety.
Resources to include
Resources to introduce
-
How can we be respectful and responsible online?
Find out more -
What are digital communication systems?
Find out more -
How do we use search tools?
Find out more -
Kiddle
Find out more
Years 3–4 How can we be respectful and responsible online?
Use this resource to remind students of ways to behave online.
Requires
- internet access
- computers, laptops or tablets; or a whiteboard to view resource as a class
Suggested time
30 minutesEnables students to:
- describe ways to be respectful and responsible online
- describe potential dangers while online.
Years 3–4 What are digital communication systems?
Use this resource to discuss ways we communicate online and responsible online behaviours.
Requires
- internet access
- computers, laptops or tablets; or a whiteboard to view resource as a class
- Note the resource contains a video that is not accessible in our region.
Suggested time
30 minutesEnables students to:
- describe the types of content available on the internet
- describe potential dangers while using the internet.
Years 3–4 How do we use search tools?
Use this resource to help explain how to use a search engine when locating information online.
Requires
- internet access
- computers, laptops or tablets
Suggested time
30 minutesEnables students to:
- describe the types of content available on the internet
- describe how to use a search engine to locate content available on the internet
- describe ways to stay safe online.
Years 3–4 Kiddle
Use this student-friendly search engine to locate content on the internet.
Requires
- internet access
- computers, laptops or tablets
- access to Kiddle
Suggested time
30 minutesEnables students to:
- describe the types of content available on the internet
- describe how to use a search engine to locate content available on the internet
- describe ways to stay safe online.
Resources to develop and consolidate learning
-
Getting started with Microsoft Whiteboard
Find out more -
Join a padlet
Find out more -
Getting started with Google Classroom
Find out more

Years 3–4 Getting started with Microsoft Whiteboard
Whiteboard makes it easy to collaborate in the classroom. Brainstorm, plan and share with students on a digital canvas, all in real time.
Requires
- internet access
- computers, laptops or tablets
- teacher access to Microsoft 360 and created whiteboard to share with students to a selected topic
Suggested time
30 minutesEnables students to:
- share content safely online
- collaborate with others
- follow agreed protocols when sharing information online.

Years 3–4 Join a padlet
Create a padlet and enable your students to access and share content online without needing an email (this helps to ensure data privacy and protecting student data).
Requires
- internet access
- computers, laptops or tablets
- teacher access to padlet app and created padlet to share with students about a selected topic
Suggested time
30 minutesEnables students to:
- share content safely online
- follow agreed protocols when sharing information online.

Years 3–4 Getting started with Google Classroom
If your school has access to Classroom, use the collaborative tools to share content.
Requires
- internet access
- computers. laptops or tablets
- electronic whiteboard to view slides as a class
Suggested time
30 minutesEnables students to:
- share content safely online
- collaborate with others
- follow agreed protocols when sharing information online.

Resources to apply and extend learning
-
Collaborate with Microsoft 365
Find out more -
Keynote for iPad
Find out more -
Mentimeter
Find out more
Years 3–4 Collaborate with Microsoft 365
Schools that have access to Microsoft 365 can collaborate; for example, using PowerPoint. Model how to collaborate on a PowerPoint presentation using this video.
Requires
- school access to Office 365
- internet access
- computers, laptops or tablets; or teacher laptop and whiteboard to view resource as a class
Suggested time
2 minutesEnables students to:
- share content safely online
- collaborate with others
- follow agreed protocols when sharing information online.
Years 3–4 Keynote for iPad
Schools that use iPads can use Keynote for students to collaborate and share content.
Requires
- school access to Apple Keynote
- student access to iPads and Keynote
Suggested time
30 minutesEnables students to:
- share content safely online
- follow agreed protocols when sharing information online.
Years 3–4 Mentimeter
Create presentations for students with live audience input, or customise a predesigned template to create quizzes for students to access via code without needing an email (this ensures data privacy and protecting student data).
Requires
- teacher to register for free version
- teacher access to Mentimeter and a teacher-created presentation or quiz
Suggested time
30 minutesEnables students to:
- share content safely online
- follow agreed protocols when sharing information online.
Introduction to programming
Overview
Students follow and describe simple algorithms involving branching and iteration and implement them as visual programs.
Achievement standards
Students follow and describe simple algorithms involving branching and iteration and implement them as visual programs.
Australian Curriculum
Content descriptions
Generating and designing AC9TDI4P02
Producing and implementing AC9TDI4P04
Related content and General capabilities
Digital Literacy: Creating and exchanging
Critical and Creative Thinking: Analysing
This topic enables students to
- follow algorithms to determine their purpose and predict outcomes
- describe and create an algorithm that includes branching and repetition
- create a program following an algorithm that includes branching and repetition.
Watch this video for a quick overview of the unit and how to use its resources with your students.
Assessment View assessment advice
Achievement standard
Digital Technologies: years 3–4
By the end of Year 4, students follow and describe simple algorithms involving branching and iteration and implement them as visual programs.
Use this Program my sprite task to assess students’ knowledge, skills and processes related to basic programming.
Use this Game time task to assess students’ knowledge, skill and processes related to designing a game represented as an algorithm.
Rubric
Use this rubric to assess student skills, processes and knowledge.
Control structures (branching and iteration)
This rubric provides benchmarks for assessing different levels of complexity and proficiency in:
- understanding of programming blocks, specifically focusing on control structures
- identifying branching and iteration
- using branching, iteration and user input in programming tasks.
| Knowledge of visual programming blocks | shows a limited understanding of visual programming blocks | names some visual programming blocks or describes their purpose | describes the purpose of the visual programming blocks and gives relevant examples to support their understanding | consistently describes the purpose of the visual programming blocks and gives relevant examples to support their understanding that illustrate blocks to enable input, make decisions based on comparing data, and include repeat steps |
| Identifies control structures: investigating sample visual programs | with guidance shows a limited ability to describe or identify blocks in given examples and with support can interpret the sequence of steps | identifies most block types in given examples and interprets the sequence of steps | consistently identifies block types correctly in simple program examples; interprets the sequence of steps and identifies user input, decisions (branching) and repeat steps (iteration) | shows a high level of accuracy in identifying block types of a range of visual programs; interprets the sequence of steps, predicts outcomes of blocks and identifies user input, branching and iteration; explains ways to enable input and make decisions and automate repeat steps |
| Producing and implementing visual programs | with guidance, creates a program in a sequence of steps to perform a basic task with limited opportunity for user input | creates a program with user input in a sequence of logical steps | creates a program with user input in a sequence of logical steps that includes a decision (branching) to provide the user with a choice | creates a program with user input in a sequence of logical steps that includes a decision (branching) and iteration (repeat steps); enables input and decisions and automates repeat steps |
Unit sequence
This topic offers 4 sequential units
Unit 1
Algorithms
Students draw on computational thinking to follow and design algorithms with branching and repetition.Unit 2
Programming a sequence
Students use a visual programming environment like Scratch or code.org’s programming challenges to learn the basics of programming.Unit 3
Branching and iteration
Students implement algorithms as visual programs involving user input, branching and repetition.Unit 4
Branching that result from a comparison
Students implement visual programs with branching that result from a comparison.Algorithms
What is this about?
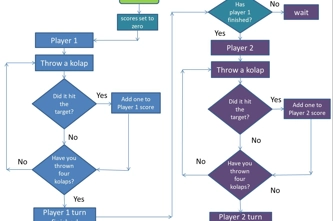
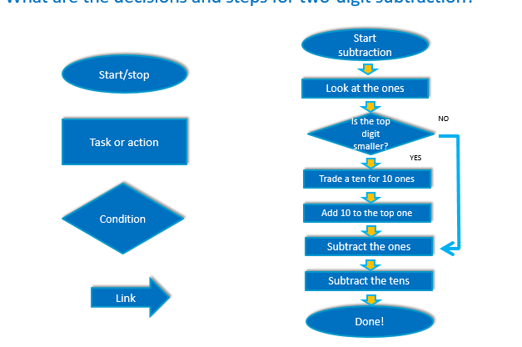
Algorithms are step-by-step instructions for solving a problem or performing a task. In Digital Technologies exploring algorithms is a way to establish the guiding logic for computer programs. An algorithm can describe a sequence of steps and decisions. Sequencing refers to placing the steps to be performed in order, one after another. Branching involves making decisions resulting in following different paths based on specific conditions. An example is in a multiple-choice quiz – the user selects the correct answer and gets positive feedback and moves to next question, else the user gets feedback to try again!
Content description
Follow and describe algorithms involving sequencing, comparison operators (branching) and iteration AC9TDI4P02
This sequence enables students to:
- describe an event using a sequence of steps and decisions
- follow and create algorithms that include decisions
- identify repeating patterns and use loops to make their algorithms more concise.
Resources to include
Resources to introduce
-
Sequencing | Lesson 3 | Camp coding camp
Find out more -
coding@home TV – Primary 2 – Designing an algorithm
Find out more -
Program your teacher to make a jam sandwich (sandwich bot)
Find out more -
Real-life algorithms: paper planes
Find out more

Years 3–4 Sequencing | Lesson 3 | Camp coding camp
Use this video to introduce algorithms with a sequence of steps.
Requires
- internet access
- computers, laptops or tablets; or interactive whiteboard to view as a class
Suggested time
4 minutesEnables students to:
- describe an algorithm that includes branching and repetition.

Years 3–4 coding@home TV – Primary 2 – Designing an algorithm
Use this video to introduce algorithms with branching and repetition (iteration).
Requires
- internet access
- computers, laptops or tablets; or interactive whiteboard to view as a class
Suggested time
24 minutesEnables students to:
- describe an algorithm that includes branching and repetition.
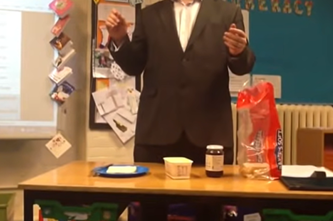
Years 3–4 Program your teacher to make a jam sandwich (sandwich bot)
Use this video to explain the need for concise, clear and accurate instructions for a robot or computer to follow.
Requires
- internet access
- computers, laptops or tablets; or interactive whiteboard to view as a class
Suggested time
4 minutesEnables students to:
- describe an algorithm that includes branching and repetition.

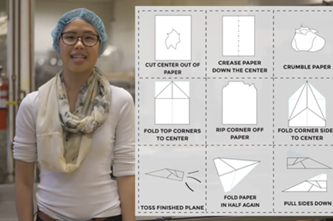
Years 3–4 Real-life algorithms: paper planes
This lesson uses the making of a paper plane to explore algorithms by putting images in their correct order.
Requires
- printed worksheet
Suggested time
1 hourEnables students to:
- arrange sequential events into their logical order of steps.

Resources to develop and consolidate learning

Years 3–4 Introducing algorithms
In this sequence of lessons, students design a sequence of steps for others to follow. They convey their instructions to peers and evaluate the work of others to determine if the outcome was successful.
Requires
- printed worksheets
Suggested time
1 hourEnables students to:
- design a sequence of steps (using words and symbols) for others to follow
- follow and describe algorithms
- evaluate the sequences of others to determine if the outcome was successful.
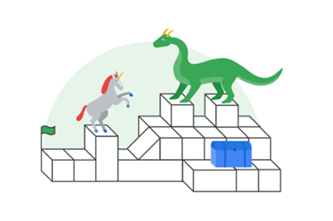
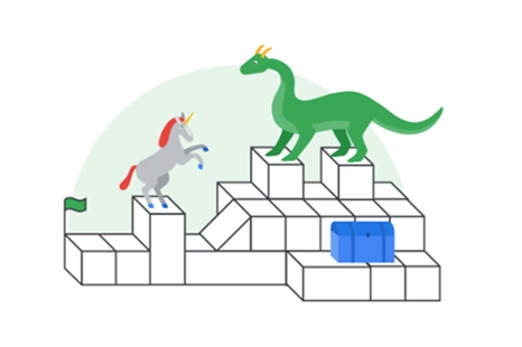
Years 3–4 Take a LEGO building challenge
In pairs, explore giving and following a sequence of steps and decisions to build a LEGO® toy.
Requires
- 3in1 LEGO® toy kit or a similar construction kit with instructions
Suggested time
1 hourEnables students to:
- follow and describe algorithms
- create an algorithm that includes branching and repetition.

Resources to extend and integrate learning
-
Algorithms for First Nations Australian games
Find out more -
Algorithms: Ngarrindjeri weaving
Find out more -
Have fun with flowcharts
Find out more -
Plan a 'choose your own adventure' story
Find out more

Years 3–4 Algorithms for First Nations Australian games
In this lesson, we explore algorithms and how they can be used to provide instructions to play a First Nations Australian instructive game. We also learn about aspects of First Nations cultures.
Requires
- internet access, computers, laptops or tablets /interactive whiteboard to view teachers slides as a class.
- teacher slides
- download game instructions
Suggested time
1 hourEnables students to:
- order instructions with branching and iteration of a game in a correct sequence
- create and follow an algorithm represented as a flow chart.

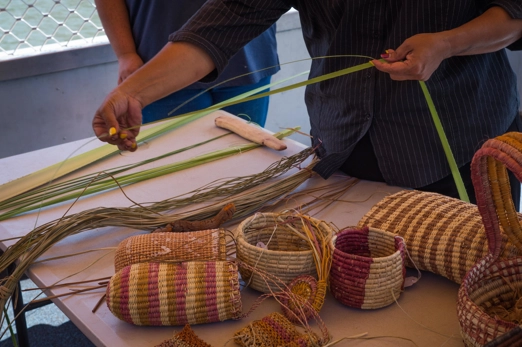
Years 3–4 Algorithms: Ngarrindjeri weaving
In this lesson, students practice following and giving accurate instructions, identifying errors, and iterating their instructions to improve clarity of information.
Requires
- internet access
- computers, laptops or tablets /interactive whiteboard to view video as a class.
- video: Weaving - Everything Is Connected
Suggested time
1–2 hoursEnables students to:
- transfer details of a process shared with them into a sequence of instructions
- create a set of directional instructions in the form of a flowchart.
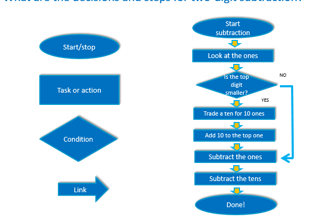
Years 3–4 Have fun with flowcharts
Create a flowchart to represent a sequence of (branching) steps and decisions needed to solve a mathematical problem.
Requires
- large sheets of paper for recording
Suggested time
1 hourEnables students to:
- create an algorithm that includes branching.
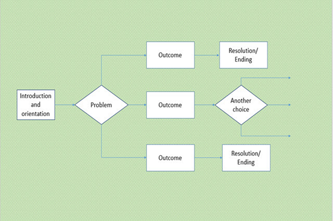
Years 3–4 Plan a 'choose your own adventure' story
Students create a storyboard to plan a ‘choose your own adventure' story, where the reader is given a number of decisions that lead to alternative endings.
Requires
- large sheets of paper for recording
Suggested time
2 hoursEnables students to:
- create an algorithm that includes branching and repetition.

Further reading and professional learning
Years 3–4 Algorithms infographic: Years 3–6
This series of three infographics provide an explanation of ‘Algorithms’ with relevant examples for each Year band and ‘I can’ statements.
Suggested time
30 minutes
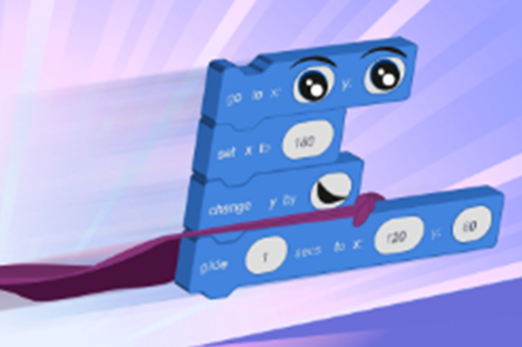
Programming a sequence
What is this about?
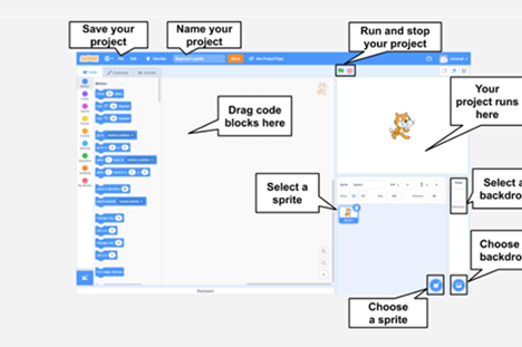
At the beginner level of programming, use a visual programming environment like Scratch, Microsoft MakeCode or code.org’s programming challenges to learn the basics of programming. Students can turn basic algorithms into a working computer program. They arrange blocks to execute steps in a specific order. They can create a basic program where the sprite (character) responds to events, moves in different directions, based on user input. User input involves information from the person using the program, often obtained through keyboard or mouse actions. For instance, the program can ask for the user's name with the question 'What's your name?' and then use that input in the program. As they grasp the basics and familiarise themselves with the range of visual blocks, students can move on to creating more advanced programs.
Content descriptions
Follow and describe algorithms involving sequencing, comparison operators (branching) and iteration AC9TDI4P02
Implement simple algorithms as visual programs involving control structures and input AC9TDI4P04
This sequence enables students to:
- identify and explain what the basic visual blocks do in a program
- create a program that executes steps in a specific order
- create a basic program where the sprite (character) responds to user input.
Resources to include
Resources to introduce
-
Conditions | Lesson 6 | Camp coding camp
Find out more -
Loops | Lesson 5 | Camp coding camp
Find out more -
Express course (2023)
Find out more -
Getting started with Scratch: your first Scratch project
Find out more -
Scratch: Get started – Grok Academy
Find out more -
A-maze-ing lesson plan for Scratch – Barclays Code Playground
Find out more -
Introduction to algorithms in Scratch – Barclays Code Playground
Find out more -
Scratch: Get moving – Grok Academy
Find out more


Years 3–4 Conditions | Lesson 6 | Camp coding camp
Use this video to introduce conditional statements, which are a form of branching in programming.
Requires
- internet access
- computers, laptops or tablets; or interactive whiteboard to view as a class
Suggested time
4 minutesEnables students to:
- describe an algorithm that includes branching and repetition
- describe ways to program a sequence that includes branching.

Years 3–4 Loops | Lesson 5 | Camp coding camp
Use this video to introduce loops as a form of iteration in programming.
Requires
- internet access
- computers, laptops or tablets; or interactive whiteboard to view as a class
Suggested time
4 minutesEnables students to:
- describe an algorithm that includes branching and repetition
- describe ways to program a sequence that includes repetition.
Years 3–4 Express course (2023)
Provide students with these self-paced courses that can be used as a starting point to learn fundamentals of programming using a supportive environment as they progress through scaffolded challenges.
Requires
- internet access
- computers, laptops
Suggested time
1 hour (per course)Enables students to:
- describe the function of familiar programming blocks
- select the correct sequence of blocks to solve a programming challenge.
Years 3–4 Getting started with Scratch: your first Scratch project
This tutorial will help students program using Scratch to program a simple project.
Requires
- laptops or desktop computers
- access to https://scratch.mit.edu
Suggested time
1 hourEnables students to:
- create an algorithm and implement as a program in Scratch
- describe basic blocks used in programming.
Years 3–4 Scratch: Get started – Grok Academy
In this step-by-step course students learn to create a project using Scratch, and to control a sprite using a sequence of instructions.
Requires
- register for free use of this tutorial and assign students to this task
- internet access
- computers, laptops
Suggested time
1–2 hoursEnables students to:
- create an algorithm and implement as a program in Scratch
- control a sprite using a sequence of instructions.

Years 3–4 A-maze-ing lesson plan for Scratch – Barclays Code Playground
The lesson introduces basic computational thinking and programming concepts by asking the class to create a maze game.
Requires
- something to use as a blindfold
- pencil and paper
- laptops or desktop computers
- access to https://scratch.mit.edu
Suggested time
45 minutesEnables students to:
- describe the instructions of a visual programming language and predict the outcome of a program written using the language
- build a simple program in Scratch to carry out a given task.
Years 3–4 Introduction to algorithms in Scratch – Barclays Code Playground
Use this simple lesson plan and accompanying guide to introduce the basics of algorithms. Ideal for students who are just starting out with computing and a first step to understanding how computers work.
Requires
- pencil and paper
- laptops or desktop computers
- access to https://scratch.mit.edu
Suggested time
45 minutesEnables students to:
- explain what an algorithm is and how they relate to real life and computer programs
- create an algorithm and program in Scratch.
Years 3–4 Scratch: Get moving – Grok Academy
In this step-by-step course students learn about how to move and position sprites in their Scratch projects.
Requires
- register for free use of this tutorial and assign students to this task
- internet access
- computers, laptops
Suggested time
1–2 hoursEnables students to:
- create an algorithm and implement as a program in Scratch
- move and position sprites in a Scratch project
- create instructions using x- and y- coordinates to make a sprite move, glide and draw lines.
Resources to develop and consolidate learning
-
Arcade games
Find out more -
Creative Computing Curriculum
Find out more -
Welcome to CS First
Find out more -
Monster maker! (Blockly - short)
Find out more


Years 3–4 Arcade games
Use these tutorials which include support for beginners as they program simple games.
Requires
- free use of this tutorial or sign in to save project
- internet access
- computers, laptops
- access to arcade.makecode.com
Suggested time
1 hour per gameEnables students to:
- with guidance, create a computer program for a simple game.

Years 3–4 Creative Computing Curriculum
Use this collection of ideas, strategies and activities to give students an introductory computing experience using the Scratch programming language.
Requires
- computers, laptops or tablets
- access to Scratch 3.0 desktop version or similar visual programming language
Suggested time
1–2 hoursEnables students to:
- create an algorithm and implement as a program in Scratch
- move and position sprites in a Scratch project.

Years 3–4 Welcome to CS First
Select from four fun projects that introduce the core elements of Scratch and foundational coding skills.
Requires
- computers, laptops or tablets
- access to Scratch 3.0 via CS First platform (free registration or can continue without sign in; however, the project won’t save)
Suggested time
1–2 hoursEnables students to:
- create an algorithm and implement as a program in Scratch
- move and position sprites in a Scratch project.
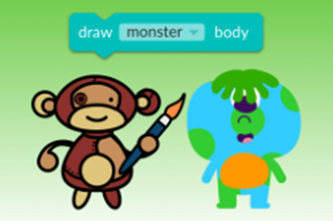
Years 3–4 Monster maker! (Blockly - short)
Use visual programming blocks to write your own programs, learn about sequence and ordering, and create fun monster characters!
Requires
- register with Grok for free use of this tutorial and assign students to this task
- internet access
- computers, laptops or tablets
Suggested time
1–2 hoursEnables students to:
- create an algorithm and implement as a program in Scratch
- move and position sprites in a Scratch project.

Resources to apply and extend learning

Years 3–4 Scratch maze – Grok Academy
Using Scratch, students create a maze and use their programming skills to control a sprite and navigate the maze.
Requires
- register for free use of this tutorial and assign students to this task
- internet access
- computers, laptops
Suggested time
1–2 hoursEnables students to:
- create an algorithm and implement as a program in Scratch
- control a sprite using a sequence of instructions.
Years 3–4 Visual programming with Scratch (years 3–6)
This resource comprises a collection of sample activities that incorporate visual programming (Scratch) into teaching and learning programs.
Requires
- computers, laptops or tablets
- access to Scratch 3.0 desktop version or similar visual programming language
Suggested time
1–2 hoursEnables students to:
- create an algorithm and implement as a program in Scratch
- control a sprite using a sequence of instructions.
Further reading and professional learning
Years 3–4 Programming infographic: Years 3–6
Use this infographic as a guide to view ways programming is covered for years 3–6.
Suggested time
30 minutes
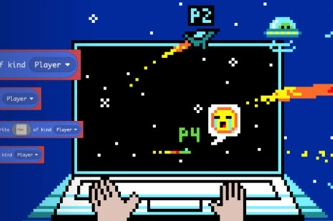
Branching and iteration
What is this about?
Once students have a basic understanding of the fundamentals of programming, they can progress to more advanced programming concepts. This includes exploring branching, where decisions direct the program's flow, and repetition loops, which enable the execution of specific actions iteratively. These elements give students the tools to create more intricate and sophisticated programs.
Content descriptions
Follow and describe algorithms involving sequencing, comparison operators (branching) and iteration AC9TDI4P02
Implement simple algorithms as visual programs involving control structures and input AC9TDI4P04
This sequence enables students to:
- identify and explain what the repeat blocks do in a program
- create a program that uses a repeat command
- explain ways to provide decisions that enable the user to choose more than two different paths
- create a program that includes decisions that enable the user to choose more than two different paths.
Resources to include
Resources to introduce
-
coding@home TV – Primary 4 – branching and repetition using Scratch
Find out more -
Introduction to loops in Scratch – Barclays Code Playground
Find out more -
Introduction to conditionals in Scratch – Barclays Code Playground
Find out more


Years 3–4 coding@home TV – Primary 4 – branching and repetition using Scratch
Use this video to explain how to include branching and repetition to make a Scratch program more interactive and to give the user choices.
Requires
- internet access
- computers, laptops or tablets; or view as a class on interactive whiteboard
Suggested time
24 minutesEnables students to:
- explain what the repeat blocks do in a program
- explain ways to provide decisions in a program that enable the user to choose different paths.

Years 3–4 Introduction to loops in Scratch – Barclays Code Playground
In this lesson students learn about loops (a form of iteration) through dance (includes a video tutorial).
Requires
- computers, laptops or tablets
- access to Scratch 3.0 desktop version or similar visual programming language
Suggested time
1 hourEnables students to:
- explain what the repeat blocks do in a program
- explain ways to provide decisions in a program that enable the user
- create a program following an algorithm that includes branching and iteration.

Years 3–4 Introduction to conditionals in Scratch – Barclays Code Playground
In this lesson students learn about conditional statements (branching) using a ‘Rock, paper scissors’ game (includes a video tutorial).
Requires
- computers, laptops or tablets
- access to Scratch 3.0 desktop version or similar visual programming language
Suggested time
2 hoursEnables students to:
- explain what the repeat blocks do in a program
- explain ways to provide decisions in a program that enable the user
- create a program following an algorithm that includes branching and iteration.

Resources to develop and consolidate learning
-
What makes computer games good?
Find out more -
Designing a mini-game
Find out more -
Getting started with Scratch Control
Find out more -
Lesson 1: code with Anna and Elsa
Find out more -
Moana Hour of code
Find out more


Years 3–4 What makes computer games good?
Use this resource as a way of supporting students to design and program their own game.
Requires
- internet access
- computers, laptops or tablets; or interactive whiteboard to view as a class
Suggested time
30 minutesEnables students to:
- explain what the repeat blocks do in a program
- explain ways to provide decisions in a program that enable the user
- create a program following an algorithm that includes branching and iteration.
Years 3–4 Designing a mini-game
In this learning sequence, students are guided to design a mini-game for a targeted audience. They use a template to plan and record their ideas for their game, considering the main characters, theme and goal for their game. Students program their game using Scratch or a similar visual programming platform. Sample Scratch programs are provided for students to remix.
Requires
- internet access
- computers, laptops or tablets
- register for free use of Scratch 3.0
Suggested time
2–4 hoursEnables students to:
- design a mini-game that has a clear purpose and is designed for a particular audience
- use branching and iteration to control the flow of their program.
Years 3–4 Getting started with Scratch Control
This guide provides a description of control blocks including decisions and iteration (repetition).
Requires
- internet access
- computers, laptops or tablets
Suggested time
1 hourEnables students to:
- describe how control blocks are used in programming
- describe ways to use conditions to make decisions
- describe ways to repeat parts of a program.
Years 3–4 Lesson 1: code with Anna and Elsa
Use this interactive course to introduce loops (iteration) and decisions (branching).
Requires
- register for free use of this tutorial and assign students to this task
- internet access
- computers, laptops or tablets
Suggested time
1 hourEnables students to:
- explain what the repeat blocks do in a program
- explain ways to provide decisions in a program that enable the user
- select the correct sequence of blocks to solve a programming challenge.
Years 3–4 Moana Hour of code
Use this interactive course to introduce loops (iteration) and decisions (branching).
Requires
- internet access
- computers, laptops
- access to code.org (course includes sound; headphones may be needed)
Suggested time
1–2 hoursEnables students to:
- explain what the repeat blocks do in a program
- explain ways to provide decisions in a program that enable the user
- select the correct sequence of blocks to solve a programming challenge.
Resources to apply and extend learning
-
Design a quiz – convicts: crime and punishment
Find out more -
Note the music
Find out more -
Logo's turtle – Turtle Academy
Find out more -
Pencilcode: first
Find out more


Years 3–4 Design a quiz – convicts: crime and punishment
Students design and create a simple game or quiz to demonstrate convict crimes and punishments.
Requires
- access to Scratch 3.0
- internet access
- computers, laptops
Suggested time
1–2 hoursEnables students to:
- create an algorithm and implement as a program in Scratch
- create a program that includes user input and branching.
Years 3–4 Note the music
Students can make their own instrument that plays a particular note for a set beat; for example, when a piano key is pressed or a guitar string is strummed or a drum skin is hit.
Requires
- computers, laptops or tablets
- access to Scratch 3.0 desktop version or similar visual programming language
Suggested time
2 hoursEnables students to:
- explain what the repeat blocks do in a program
- explain ways to provide decisions in a program that enable the user to interact with the program
- create a program following an algorithm that includes branching and iteration.

Years 3–4 Logo's turtle – Turtle Academy
Use this self-paced interactive tutorial to control the turtle using Logo commands and introduce repetition (iteration).
Requires
- internet access
- computers, laptops
- access to Turtle Academy (free, no registration required)
Suggested time
1–2 hoursEnables students to:
- explain what the repeat blocks do in a program
- select the correct sequence of blocks to solve a programming challenge.
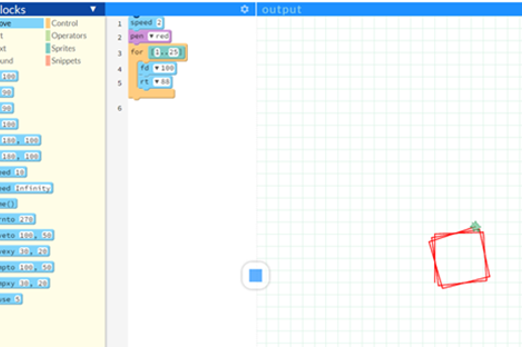
Years 3–4 Pencilcode: first
Use a drawing program to incorporate repeat instructions creating shapes by programming an on-screen turtle.
Requires
- internet access
- computers, laptops
- access to pencilcode.net
Suggested time
1 hourEnables students to:
- control a sprite using a sequence of instructions
- use iteration to make the program more efficient.
Branching that result from a comparison
What is this about?
As students develop their programming skills they can create more complex programs. At certain steps in the sequence students may want an input to make a decision. To get a true or false answer, branching decisions may result from a comparison. The operator may be: < (less than), > (greater than) or = (equal to).
Content description
Follow and describe algorithms involving sequencing, comparison operators (branching) and iteration AC9TDI4P02
Implement simple algorithms as visual programs involving control structures and input AC9TDI4P04
This sequence enables students to:
- identify and explain what the operator blocks do in a program
- create a program that uses branching decision results from a comparison
- explain ways to provide decisions that enable the user to choose a different pathway
- create a program that includes branching decisions that result from a comparison.
Resources to include
Resources to introduce
-
Programming with sensors
Find out more -
Sunlight sensor
Find out more -
Environment exploration
Find out more

Years 3–4 Programming with sensors
Use this resource to explore branching in programs taking in information from sensors as a lead-in to conditional statements that compare data.
Requires
- internet access
- computers, laptops or tablets; or interactive whiteboard to view as a class
Suggested time
30 minutesEnables students to:
- describe ways to create a program that uses branching including decisions that result from a comparison.

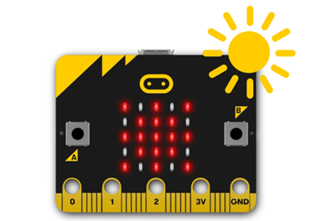
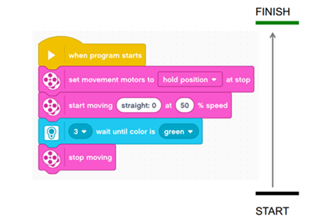
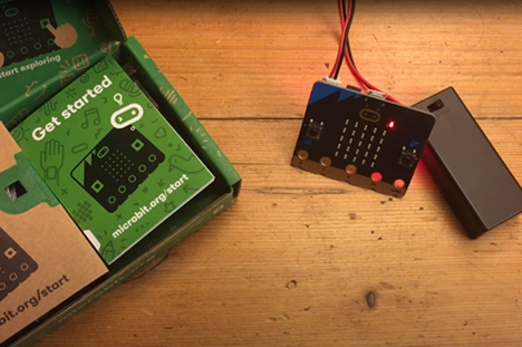
Years 3–4 Sunlight sensor
Turn the LED display into a sensor to make your micro:bit react to light using comparison operators.
Requires
- internet access
- computers, laptops
- access to makecode.org
- physical micro:bit (optional)
Suggested time
45 minutesEnables students to:
- identify and explain what the operator blocks do in a program
- create a program that uses branching decision results from a comparison.
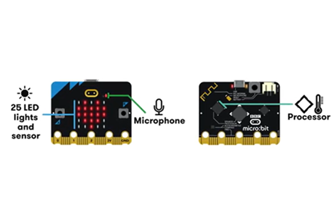
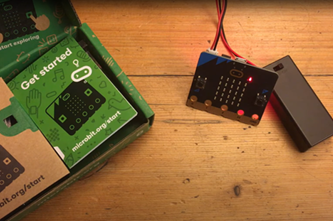
Years 3–4 Environment exploration
Turn a micro:bit into a tool for measuring temperature, light and sound levels as part of a science investigation into your environment. Improve the program to include comparison operators.
Requires
- internet access
- computers, laptops
- access to makecode.org
- micro:bit
Suggested time
45 minutesEnables students to:
- identify and explain what the operator blocks do in a program
- create a program that uses branching decision results from a comparison.

Resources to develop and consolidate learning
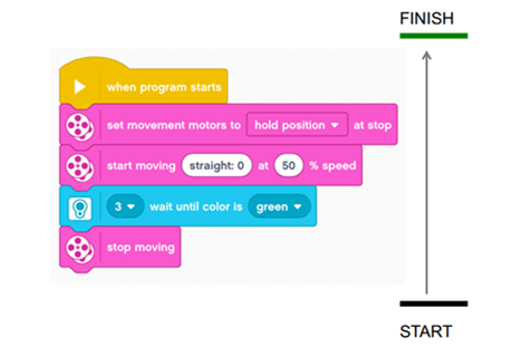
Years 3–4 Colour sensor (EV3 Classroom)
Learn how to use a sensor that lets an EV3 program measure and collect data about its surroundings. If it senses a certain colour then it moves.
Requires
- EV3 robot or similar robot that has a light sensor
Suggested time
1 hourEnables students to:
- identify and explain what the operator blocks do in a program
- create a program that uses branching decision results from a comparison.
Years 3–4 Scratch tutorial 14 – sensing
Students can view this Scratch tutorial (on YouTube) for ideas related to colour sensing.
Requires
- computers, laptops or tablets
- access to Scratch 3.0 desktop version or similar visual programming language
Suggested time
1 hourEnables students to:
- identify and explain what the operator blocks do in a program
- create a program that uses branching decision results from a comparison.
Resources to apply and extend learning

Years 3–4 Clap lights
Students can turn a micro:bit into a light that can turn on and off by clapping or making any loud sound. This activity includes creating a variable, which is an expectation in years 5–6.
Requires
- internet access
- computers, laptops
- access to makecode.org
- micro:bit
Suggested time
45 minutesEnables students to:
- identify and explain what the operator blocks do in a program
- create a program that uses branching decision results from a comparison.
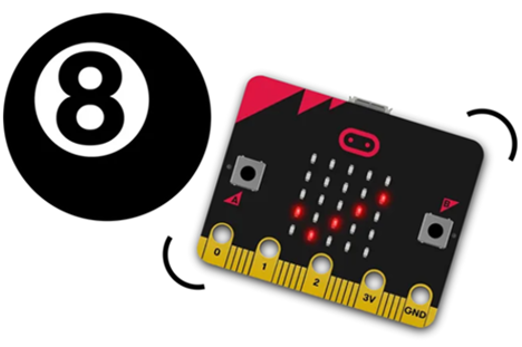
Years 3–4 Magic 8-ball – micro:bit
Recreate a version of magic ball and customise it to make it your own. This activity includes creating a variable, which is an expectation in years 5–6.
Requires
- internet access
- computers, laptops
- access to makecode.org
- micro:bit
Suggested time
45 minutesEnables students to:
- identify and explain what the operator blocks do in a program
- create a program that uses branching decision results from a comparison.
Programming a simple digital solution
Overview
This unit outlines a teaching sequence, starting with identifying user needs and co-developing a user story, followed by the design and implementation of a digital solution that includes sequencing, branching and iteration (repetition).
Achievement standards
By the end of Year 4 students create simple digital solutions and use provided design criteria to check if solutions meet user needs. They follow and describe simple algorithms involving branching and iteration and implement them as visual programs.
Australian Curriculum
Content descriptions
Investigating and defining AC9TDI4P01
Generating and designing AC9TDI4P02, AC9TDI4P03
Producing and implementing AC9TDI4P04
Evaluating AC9TDI4P05
Related content and General capabilities
English: Literature and contexts
Digital Literacy: Creating and exchanging
Critical and Creative Thinking: Analysing
This topic enables students to
- describe a range of familiar problems and generate possible solutions
- co-create a user story that describes their role, the goal and reason
- follow algorithms to determine their purpose and predict outcomes
- describe and create an algorithm that includes branching and repetition
- create a program following an algorithm that includes branching and repetition
- evaluate their program based on the user needs to see how well it met their needs.
Watch this video for a quick overview of the unit and how to use its resources with your students.
Assessment View assessment advice
Achievement standard
Digital Technologies: years 3–4
By the end of Year 4, students create simple digital solutions and use provided design criteria to check if solutions meet user needs. They follow and describe simple algorithms involving branching and iteration and implement them as visual programs.
Rubric
Use this rubric to assess student skills, processes and knowledge.
Control structures (branching and iteration)
This rubric provides benchmarks for assessing different levels of complexity and proficiency in:
- understanding and identifying the needs of a user in their design
- understanding of programming blocks, specifically focusing on control structures
- identifying branching and iteration
- using branching, iteration and user input in programming tasks.
| Generate designs incorporating user needs | with guidance, can describe the problem and with help can identify the needs for their generated design | defines the problem, identifies the user type and their needs and how their generated design meets those needs | defines the problem, identifies user type and their needs, co-develops a user story showing the goal to be accomplished and the reason for the goal | clearly defines the problem and identifies user type and their needs, co-develops a user story showing the goal to be accomplished and the reason for the goal; generates a design that clearly shows how the user experience is improved and meets the user needs and design criteria |
| Knowledge of visual programming blocks | shows a limited understanding of visual programming blocks | names some visual programming blocks or describes their purpose | describes the purpose of the visual programming blocks and gives relevant examples to support their understanding | consistently describes the purpose of the visual programming blocks and gives relevant examples to support their understanding; uses examples that illustrate blocks to enable input, make decisions based on comparing data, and include repeat steps |
| Identifies control structures: investigating sample visual programs | with guidance shows a limited ability to describe or identify blocks in given examples and with support can interpret the sequence of steps | identifies most block types in provided examples and interprets the sequence of steps | consistently identifies block types correctly in simple program examples; interprets the sequence of steps and identifies user input, decisions (branching) and repeat steps (iteration) | shows a high level of accuracy in identifying block types of a range of visual programs; interprets the sequence of steps, predicts outcomes of blocks and identifies user input, branching and iteration; explains ways to enable input and make decisions and automate repeat steps |
| Producing and implementing visual programs | with guidance, creates a program in a sequence of steps to perform a basic task with limited opportunity for user input | creates a program with user input in a sequence of logical steps | creates a program with user input in a sequence of logical steps that includes a decision (branching) to provide the user with a choice | creates a program with user input in a sequence of logical steps that includes a decision (branching) and iteration (repeat steps); enables input and make decisions and automate repeat steps |
Unit sequence
This topic offers 2 sequential units
Unit 1
Who are you designing for?
Students consider who the user is and what their needs are when designing a simple solution.Unit 2
Programming a digital solution
Students design a digital solution and implement it as a visual program involving user input, branching and repetition.Who are you designing for?
What is this about?
An important part of the design process is to consider the user, who they are and what they need. We can use what we call a ‘user story’ to help define the purpose and the user experience. For example, a user story might say, ‘As a player, I want to control a character with arrow keys to navigate through a game and collect stars for points’ or ‘As a reader, I want a way to read that is fun so that I can overcome my difficulty in keeping interest’. When designing a digital solution, the user story informs the development of the algorithm that we use to implement as a computer program.
Content descriptions
Define problems with given design criteria and by co-creating user stories AC9TDI4P01
Generate, communicate and compare designs AC9TDI4P03
This sequence enables students to:
- describe a range of familiar problems and generate possible solutions
- co-create a user story that describes their role, the goal and reason.
Resources to include
Resources to introduce
Years 3–4 coding@home TV – Primary 1 – finding a target audience
View the video (23:36 min) to introduce understanding the user needs design process using the example of a chatbot.
Requires
- internet access
- computer and interactive whiteboard to view as a class
Suggested time
24 minutesEnables students to:
- describe steps of design to suit user needs and importance of empathising
- explain the importance of identifying the needs of a user.

Resources to develop and consolidate learning
Years 3–4 Redesign the school lunch experience
Use this unplugged activity to help your students focus on user needs and follow the design process. (You may wish to substitute a different focus instead of school lunches).
Requires
- printed worksheets (provided by resource)
Suggested time
2 hoursEnables students to:
- identify needs of a user
- define the problem
- generate possible solutions
- create a prototype and gain feedback on design.
Resources to extend and integrate learning

Years 3–4 User story
Use these slides to support and guide students to develop a user story as part of the ideation phase of the design process.
Requires
- internet access
- computer and interactive whiteboard to view slides as a class
- slides (PowerPoint)
Suggested time
1 hourEnables students to:
- identify needs of a user
- co-create a user story
- explain how a user story is used in the design process.

Years 3–4 DT applied design thinking mix-in teacher workbook
Use a step-by-step approach to introducing user stories with your students (refer to page 35). Includes a worksheet to guide the activity.
Requires
- printed worksheet
Suggested time
1 hourEnables students to:
- identify needs of a user
- co-create a user story
- explain how a user story is used in the design process.
Programming a digital solution
What is this about?
As students develop their understanding of user stories they can use them when designing their algorithms which they then implement as a visual program. As user stories is a relatively new inclusion in the curriculum it may need to be explicitly connected when designing algorithms and programming solutions. Prompting students to think about who the user might be, what they want and their reasons why that need is important, can help students in the design phase. Students create their program exploring branching, where decisions direct the program's flow, and repetition loops, which enable the execution of specific actions iteratively. They then evaluate their program based on the user needs to see how well it met their needs.
Content descriptions
Define problems with given design criteria and by co-creating user stories AC9TDI4P01
Generate, communicate and compare designs AC9TDI4P03
Follow and describe algorithms involving sequencing, comparison operators (branching) and iteration AC9TDI4P02
Implement simple algorithms as visual programs involving control structures and input AC9TDI4P04
Discuss how existing and student solutions satisfy the design criteria and user stories AC9TDI4P05
This sequence enables students to:
- identify and explain what the basic visual blocks do in a program
- create a program that executes steps in a specific order
- creates a basic program where the sprite (character) responds to user input.
Resources to include
Resources to introduce

Years 3–4 Storytelling
Students use code to tell fun and interactive stories for a user who needs reading support.
Requires
- internet access
- computers, laptops
- access to CS First resources
Suggested time
1 hour (per course)Enables students to:
- describe the needs of a user
- co-create a user story
- describe the function of familiar programming blocks
- create an algorithm and implement as a program in Scratch.
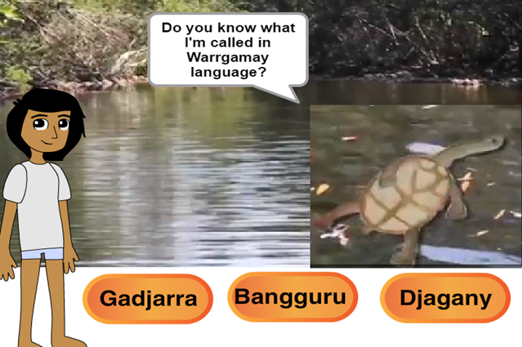
Years 3–4 Create a language learning program
Create a computer program to learn a traditional Aboriginal or Torres Strait Islander language.
Requires
- internet access
- computers, laptops
- access to Scratch 3.0 desktop version or similar visual programming language
Suggested time
2 hoursEnables students to:
- describe the needs of a user
- co-create a user story
- describe the function of familiar programming blocks
- create an algorithm and implement as a program in Scratch.
Resources to develop and consolidate learning


Years 3–4 Fun projects with language translation
Use sample Scratch programs for students to remix and modify to create their own programs that include input, branching and iteration.
Requires
- internet access
- computers, laptops
- access to https://scratch.mit.edu
Suggested time
2–4 hoursEnables students to:
- describe the needs of a user
- co-create a user story
- describe the function of familiar programming blocks
- create an algorithm and implement as a program in Scratch.

Years 3–4 Sphero and the chocolate factory
This activity allows students to use the visual programming software Lightning Lab to control Sphero to act out the role of a fictional character.
Requires
- internet access
- computers, laptops
- access to Lightning Lab software and a Sphero robot
Suggested time
1–2 HOURSEnables students to:
- describe the needs of a user
- co-create a user story
- describe the function of familiar programming blocks
- create an algorithm and implement as a program to control a robot.

Resources to apply and extend learning
-
Automated soil moisture sensor
Find out more -
Today's mission – Book to Code
Find out more -
Create a board game that uses an Ozobot
Find out more
Years 3–4 Automated soil moisture sensor
Create a solution for a person who needs to water plants efficiently.
Requires
- internet access
- computers, laptops
- access to makecode.org
- micro:bit (optional)
Suggested time
1–2 hoursEnables students to:
- describe the needs of a user
- co-create a user story
- describe the function of familiar programming blocks
- create an algorithm and implement as a program.
Years 3–4 Today's mission – Book to Code
Use the tutorial to learn about the tools needed to make a Scratch project about your favourite book to help someone read.
Requires
- internet access
- computers, laptops
- access to digitalmoment.org
Suggested time
1–2 hoursEnables students to:
- describe the needs of a user
- co-create a user story
- describe the function of familiar programming blocks
- create an algorithm and implement as a program.
Years 3–4 Create a board game that uses an Ozobot
Create a game board where the player is provided with a number of decisions. Using Scratch and Makey Makey, students add multimodal elements to the story. These elements are activated using an Ozobot.
Requires
- computers, laptops or tablets
- access to Scratch 3.0 desktop version or similar visual programming language
- Ozobot
- Makey Makey
Suggested time
2–3 hoursEnables students to:
- describe the needs of a user
- co-create a user story
- describe the function of familiar programming blocks
- create an algorithm and implement as a program in Scratch.

Further reading and professional learning
Years 3–4 Programming infographic: Years 3–6
Use this infographic as a guide to view ways programming is covered for years 3–6.
Suggested time
30 minutes
Using data purposefully
Overview
This unit explores how text, numbers, sound and images are transmitted between digital systems. Students explore symbols and images, and learn about the conventions of data representation. They apply their understanding by representing the same data in various ways.
Achievement standards
By the end of Year 4, students process and represent data for different purposes. Students securely access and use digital systems and their peripherals for a range of purposes, including transmitting data.
Australian Curriculum
Content descriptions
Digital systems AC9TDI4K01, AC9TDI4K02
Data representation AC9TDI4K03
Related content and General capabilities
Mathematics
Year 3 | Statistics
Acquire data for categorical and discrete numerical variables to address a question of interest or purpose by observing, collecting and accessing data sets; record the data using appropriate methods including frequency tables and spreadsheets AC9M3ST01
Year 4 | Statistics
Acquire data for categorical and discrete numerical variables to address a question of interest or purpose, using digital tools; represent data using many-to-one pictographs, column graphs and other displays or visualisations; interpret and discuss the information that has been created AC9M4ST01
HASS F–6
Year 3 | Skills: Questioning and researching
Locate, collect and record information and data from a range of sources, including annotated timelines and maps AC9HS3S02
Year 4 | Skills: Questioning and researching
Locate, collect and record information and data from a range of sources, including annotated timelines and maps AC9HS4S02
Digital Literacy: Investigating
This topic enables students to
- identify digital systems used to transmit data
- describe ways data is represented as text, numbers, sound and images
- describe ways the same data is represented differently
- use a digital device to represent information about their favourite animal using sound, image and text
- design a symbol to represent an idea.
Watch this video for a quick overview of the unit and how to use its resources with your students.
Assessment View assessment advice
Achievement standard
By the end of Year 4, students process and represent data for different purposes. Students securely access and use digital systems and their peripherals for a range of purposes, including transmitting data.
Rubric: Digital systems, Data representation
| Use digital systems and their peripherals for a range of purposes | with guidance, uses a digital system for a particular purpose | uses a digital system including peripherals for a particular purpose | uses a digital system including peripherals for a particular purpose, describing how the device transmits the data as text, sound and images | uses a digital system including peripherals for a particular purpose, describing how the device transmits the data as text, sound and images; and justifies their choice of digital system |
| Knowledge of data representation for different purposes | with guidance, identifies types of data | identifies types of data and names them (such as text, numerical data, sound, picture, symbol or object) | identifies types of data and names them (such as text, numerical data, sound, picture, symbol or object) and describes ways they suit a particular purpose | identifies types of data and names them (such as text, numerical data, sound, picture, symbol or object), describes ways they suit a particular purpose and explains why one type of representation is better than another |
| Demonstrate ways to represent data suited to a particular purpose | with guidance, represents data using a picture, symbol or object | uses pictures, symbols or objects to represent ideas or actions | uses pictures, symbols or objects to represent ideas or actions, selecting a form of representation that suits the purpose | uses pictures, symbols or objects to represent ideas or actions, selecting a form of representation that suits the purpose and justifies their choice |
Unit sequence
This topic offers 2 sequential units
Unit 1
Exploring types of data
Students explore how text, numbers, sound and images are transmitted between digital systems.Unit 2
Data detectives: symbols
Students explore symbols and images, and learn about the conventions of data representation. They apply their understanding by representing the same data in various ways.Exploring types of data
What is this about?
Exploring how text, numbers, sound and images are transmitted between digital systems. Students explore ways data can be transmitted between digital systems; for example, text (such as a blog post), numeric (for example, survey results), sound (for example, audio recordings) and images (photo and video). This understanding lays the groundwork for more advanced concepts, such as the way data is represented using binary – a system that uses only zeros and ones. It is a fundamental concept of data representation. The Mathematics learning area can be integrated with Digital Technologies to make learning more meaningful by combining data acquisition (statistics) and types of data (data representation).
Content description
Explore and describe a range of digital systems and their peripherals for a variety of purposes AC9TDI4K01
Explore transmitting different types of data between digital systems AC9TDI4K02
Recognise different types of data and explore how the same data can be represented differently depending on the purpose AC9TDI4K03
This sequence enables students to:
- identify the digital systems used to transmit data
- describe ways data is represented as text, numbers, sound and images
- conduct a simple survey to acquire data
- record the survey data using tally marks, numbers or pictures
- organise data into groups
- describe ways the same data can be represented differently.
Resources to include
Resources to introduce

Years 3–4 What is data?
Use this slide presentation to explain the term ‘data’.
Requires
- internet connectivity
- computer and interactive whiteboard to display website
Suggested time
30 minutesEnables students to:
- identify ways data is represented
- describe ways data is represented as text, numbers, sound and images.
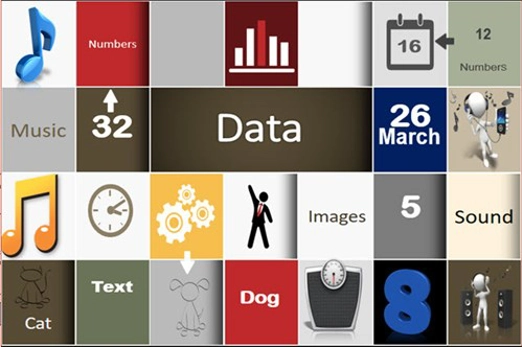
Years 3–4 How do digital systems store information?
Use this resource to discuss how data is transmitted and stored in digital systems. This resource makes reference to binary (in a simple way). Binary is covered in more detail in years 5–6.
Requires
- internet connectivity
- computer and interactive whiteboard to display website
Suggested time
30 minutesEnables students to:
- describe how data is transmitted and stored in digital systems
- describe ways data is represented as text, numbers, sound and images.
Resources to develop and consolidate learning
Years 3–4 How are digital photos and videos made?
Use this resource to discuss ways that data is represented using images, and the digital systems used to transmit the data.
Requires
- internet connectivity
- computer and interactive whiteboard to display website
Suggested time
30 minutesEnables students to:
- identify the digital systems used to transmit data
- describe ways data is represented as text, numbers, sound and images.
Years 3–4 My favourite animal
Use these slides to introduce the task of representing information about a student’s favourite animal using audio, image, video and text.
Requires
- internet connectivity
- computer and interactive whiteboard to display slides
- student access to digital systems with camera and microphone and presentation software
Suggested time
1 hourEnables students to:
- identify the digital systems used to transmit data
- describe ways data is represented as text, numbers, sound and images
- use a digital device to represent information about their favourite animal using sound, image and text.

Resources to apply and extend learning
-
Creating and understanding charts and graphs
Find out more -
Rubbish recording and reduction: Part 1
Find out more -
Rubbish recording and reduction: Part 2
Find out more -
Schoolyard biodiversity detectives
Find out more
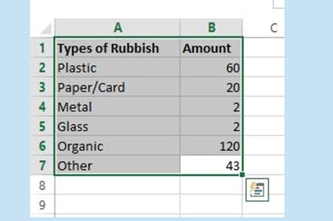

Years 3–4 Creating and understanding charts and graphs
Use this resource to discuss ways that data is represented using numbers and text; and the digital systems and software used to organise, display and store the data.
Requires
- internet connectivity
- computer and interactive whiteboard to display website
Suggested time
30 minutesEnables students to:
- identify the digital systems and software used to store and use data
- describe ways data is represented as text, numbers. sound and images.
Years 3–4 Rubbish recording and reduction: Part 1
In this lesson sequence students acquire and represent data related to school lunches and what becomes rubbish.
Requires
- school lunchboxes
- systems with camera such as an iPad/tablet
- Excel or Numbers spreadsheet software
Suggested time
1 hourEnables students to:
- conduct a simple survey to acquire data
- record the survey data using tally marks, numbers or pictures
- organise data into groups
- represent data using images, symbols and text
- describe ways the same data can be represented differently.
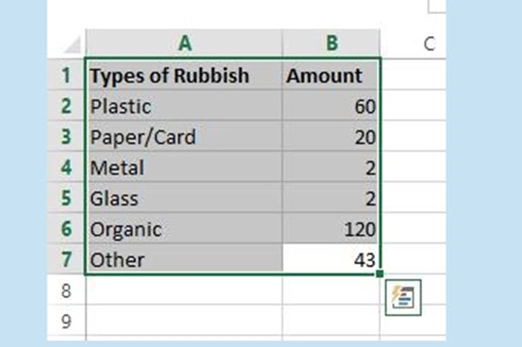
Years 3–4 Rubbish recording and reduction: Part 2
In this lesson sequence students use a spreadsheet such as Excel to display numeric data in a variety of ways.
Requires
- Excel or Numbers spreadsheet software
Suggested time
1 hourEnables students to:
- organise the data using tables and lists
- represent data using images, symbols and text
- describe ways the same data can be represented differently.

Years 3–4 Schoolyard biodiversity detectives
In this lesson students acquire and represent data related to biodiversity in the schoolyard.
Requires
- image creating software
Suggested time
1 hourEnables students to:
- conduct a simple survey to acquire data
- record the survey responses using tally marks, numbers or pictures
- represent data using images, symbols and text
- organise the data using tables and lists
- describe ways the same data can be represented differently.
Professional learning

Years 3–4 Data representation
Use this infographic to explore ways to represent data for your year level.
Suggested time
30 minutes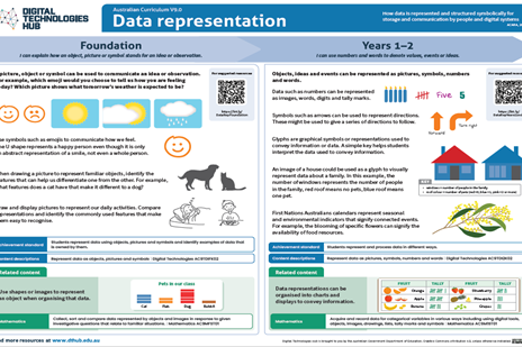
Years 3–4 Classroom ideas: years 3–4 data
Use this resource to explore ways to acquire and represent data.
Suggested time
30 minutes
Data detectives: symbols
What is this about?
Using established conventions for representing data helps create a common understanding, allowing individuals from diverse backgrounds to interpret and act upon visual information efficiently. When representing data using symbols and images, students can explore these conventions and apply their understanding of ways to represent the same data in different ways. Flags, maps and public systems such as transport provide a useful context to explore data representation and representing data for a purpose. Braille, a system designed for people who are blind or have visual impairment, enables reading through raised dots that represent letters, numbers and symbols. QR codes are another way to represent weblinks.
Content descriptions
Explore transmitting different types of data between digital systems AC9TDI4K02
Recognise different types of data and explore how the same data can be represented differently depending on the purpose AC9TDI4K03
This sequence enables students to:
- describe ways data is represented as text, numbers, sound and images
- describe ways the same data is represented differently
- design a symbol to represent an idea.
Resources to include
Resources to introduce
-
State flags, emblems, and icons
Find out more -
Australian Flag
Find out more -
Aboriginal Flag
Find out more -
Torres Strait Islander Flag
Find out more -
The case of the missing emu
Find out more -
National Heritage Places
Find out more


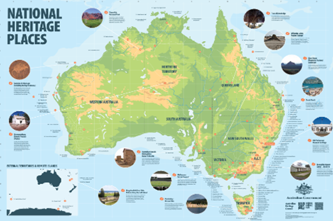
Years 3–4 State flags, emblems, and icons
Use this resource to discuss ways we use images including symbols to represent and convey information. Customise the information to discuss relevant examples from your state or territory.
Requires
- internet connectivity
- computer and interactive whiteboard to display website
Suggested time
30 minutesEnables students to:
- describe ways data is represented as text, numbers, sound and images
- describe ways the same data can be represented.
Years 3–4 Australian Flag
Use this resource to discuss ways we use shapes and symbols to represent and convey information.
Requires
- internet connectivity
- computer and interactive whiteboard to display website
Suggested time
30 minutesEnables students to:
- describe ways date is represented as text, numbers, sound and images
- describe ways the same data can be represented differently.

Years 3–4 Aboriginal Flag
Use this resource to discuss ways we use colour and shape to represent and convey information.
Requires
- internet connectivity
- computer and interactive whiteboard to display website
Suggested time
30 minutesEnables students to:
- describe ways data is represented as text, numbers, sound and images
- describe ways the same data can be represented differently.

Years 3–4 Torres Strait Islander Flag
Use this resource to discuss ways we use colour and shape to represent and convey information.
Requires
- internet connectivity
- computer and interactive whiteboard to display website
Suggested time
30 minutesEnables students to:
- describe ways data is represented as text, numbers, sound and images
- describe ways the same data can be represented differently.

Years 3–4 The case of the missing emu
Use this worksheet to bring together what students know about the symbolism used in the Australian, Aboriginal and Torres Strait Islander flags.
Requires
- printed worksheet
Suggested time
1 hourEnables students to:
- describe ways data is represented as text, numbers, sound and images
- describe ways the same data can be represented differently.

Years 3–4 National Heritage Places
Use this downloadable map of Australia to explore the ways data is represented on a map to convey information.
Requires
- internet connectivity
- computer and interactive whiteboard to display the resource
Suggested time
30 minutesEnables students to:
- describe ways data is represented as text, numbers, sound and images
- describe ways the same data can be represented differently.

Resources to develop and consolidate learning
-
Key to icons and line codes
Find out more -
Public transport symbols
Find out more -
Communication Access
Find out more -
TravelSmart map: Melbourne
Find out more -
Choose Your Own Safe Journey
Find out more
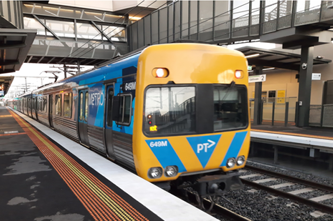

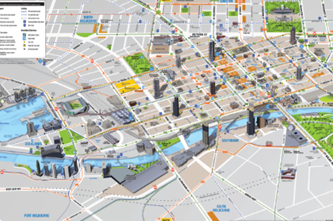

Years 3–4 Key to icons and line codes
Use this resource to predict and check what types of icons you may find in public transport, specifically the rail system.
Requires
- internet connectivity
- computer and interactive whiteboard to display website
Suggested time
30 minutesEnables students to:
- describe ways data is represented as text, numbers, sound and images
- describe ways the same data can be represented differently.
Years 3–4 Public transport symbols
Public transport symbols Use these slides to explore ways data can be represented in different ways depending on the purpose.
Requires
- internet connectivity
- computer and interactive whiteboard to display slides
Suggested time
45 minutesEnables students to:
- describe ways data is represented as text, numbers, sound and images
- describe ways the same data can be represented differently.
Years 3–4 Communication Access
Discuss the ways symbols and drawings are used to convey information and that the same data can be represented in different ways. Compare and contrast the different accessible versions of the communication boards provided. Site includes ‘Text to audio’ (requires a device with speakers).
Requires
- internet connectivity
- computer and interactive whiteboard to display website
- printable information sheets
Suggested time
1 hourEnables students to:
- describe ways data is represented as text, numbers, sound and images
- describe ways the same data can be represented differently.

Years 3–4 TravelSmart map: Melbourne
Use this resource to discuss how symbols are used to convey meaning. If possible, use a comparable map of your local area.
Requires
- internet connectivity
- computer and interactive whiteboard to display website
Suggested time
30 minutesEnables students to:
- describe ways data is represented as text, numbers, sound and images
- describe ways the same data can be represented differently.

Years 3–4 Choose Your Own Safe Journey
Use this resource to incorporate safe train travel and hunt for symbols used on public transport.
Requires
- internet connectivity
- computer and interactive whiteboard to display website
Suggested time
30 minutesEnables students to:
- describe ways data is represented as text, numbers, sound and images
- describe ways the same data can be represented differently.

Resources to apply and extend learning
-
Using QR codes in the classroom
Find out more -
Braille: deciphering the code
Find out more -
Teaching an AI to recognise fractions
Find out more -
DT laundry
Find out more
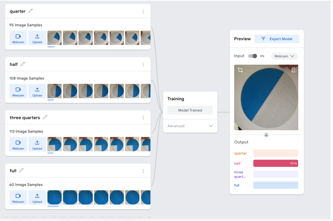

Years 3–4 Using QR codes in the classroom
Use this resource for ideas on how to incorporate QR codes into learning about data representation. QR codes encode information such as website links, text or other data types, allowing quick and easy access via a smart phone or QR code reader.
Requires
- internet connectivity
- computer and interactive whiteboard to display website
- device that has a QR code generator and reader app
Suggested time
30 minutesEnables students to:
- describe ways data is represented as text, numbers, sound and images
- describe ways the same data can be represented differently.
Years 3–4 Braille: deciphering the code
Use this resource to explore how braille, a tactile writing system using raised dots, represents letters, numbers and symbols.
Requires
- internet connectivity
- computer and interactive whiteboard to display website
Suggested time
1 hourEnables students to:
- describe ways data is represented as text, numbers, sound and images
- describe ways the same data can be represented differently.
Years 3–4 Teaching an AI to recognise fractions
Use this lesson to use a digital device to store and transmit data using the training of an AI to recognise fractions represented as images.
Requires
- internet connectivity
- computer and interactive whiteboard to display website
- access to Teachable Machine
Suggested time
1 hourEnables students to:
- describe ways data is represented as text, numbers, sound and images
- represent fractions using images
- describe ways the same data can be represented differently.
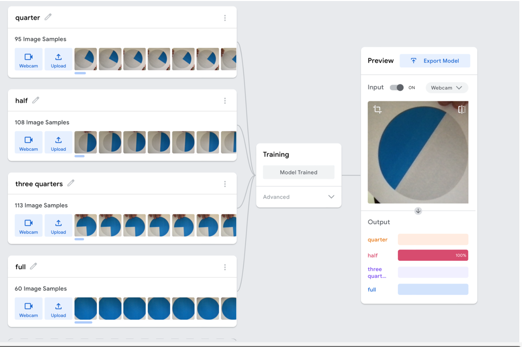
Years 3–4 DT laundry
Use this take-home resource to explore symbols used to convey information about laundry.
Requires
- printed sheet
Suggested time
1 hourEnables students to:
- describe ways data is represented as text, numbers, sound and images
- design a symbol to represent an idea.