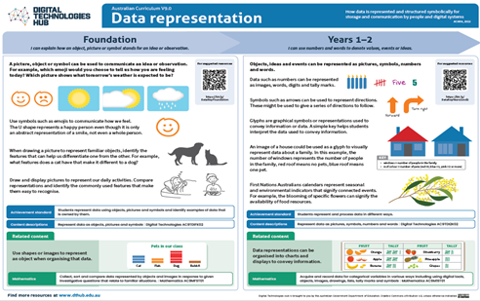
Data representation: F-10 infographic
Data representation is a core concept that is introduced in Foundation year and continues through to Year band 9-10.
These infographics are designed to assist in the interpretation of the Australian Curriculum V9.
Download and use these A3 posters in planning sessions and use them to view the progression of this core concept across Year bands.
Additional details
| Year band(s) | Foundation, 1-2, 3-4, 5-6, 7-8, 9-10 |
|---|---|
| Content type | Professional learning, Whole School |
| Format | Downloadable resources |
| Core and overarching concepts | Data representation |
| Keywords | symbols, binary, image compression , DT Hub infographic |
| Integrated, cross-curriculum, special needs | Mathematics, Science |
| Organisation | Education Services Australia |
| Copyright | Creative Commons Attribution 4.0, unless otherwise indicated |
Related resources
-
Big Data
This comprehensive online guide, provides a background on big data. This topic has information on data mining and predictive analytics.
-
Compression
This comprehensive online guide, provides a background to compression. Compression is a technique that reduces file size. This topic has information about lossy and lossless.
-
SQL
This comprehensive online guide, provides a background to databases in particular SQL. SQL is short for Structured Query Language; it's a language that is used for constructing statements called queries to perform operations on the data within a database.
-
Databases
This comprehensive online guide, provides a background to databases. This topic has information about simple databases and more complex ones that include a set of related tables, each with fields and keys
-
Representation of numbers
This comprehensive online guide, provides a background to ways number is represented in computer systems. This topic provides information on binary (base-2) and hexadecimal (hex or base-16) that are used by computers.
-
Representation of text
This comprehensive online guide, provides a background to ways text is represented in computer systems. This topic has information about ASCII and Unicode.
-
Representation of sound
This comprehensive online guide, provides a background to ways sounds are represented in computer systems. This topic has information about data that is stored and processed within a computer system, must be in binary form (digital data).
-
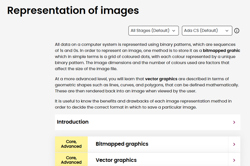
Representation of images
This comprehensive online guide, provides a background to ways images are represented in computer systems. This topic has information about bitmapped graphics and vector graphics.