Scope and sequence (F–10)
Learning programs to support implementation
Sequenced topics that could be used in teaching the Australian Curriculum Digital Technologies curriculum to address the content descriptions of the curriculum. The Scope and sequence has been updated to support teachers to implement AC:DT V9.0.
Select a topic across a two year cycle
Recommended any combination of three topics per year.
Choose a combination of units that suits your students and context.
Cycle one (Year 5)
Cycle one (Year 5)
| Jan | Jun | Dec | |||||||||
|---|---|---|---|---|---|---|---|---|---|---|---|
Cycle two (Year 6)
| Jan | Jun | Dec | |||||||||
|---|---|---|---|---|---|---|---|---|---|---|---|
Representing data in digital systems
Overview
This unit explores binary numbers through pixel-based image creation to help students understand the purpose and functionality of binary. It also covers data types as we explore how information is represented internally in digital systems and the operations that can be performed on it.
Achievement standards
Students process data and show how digital systems represent data. They design algorithms involving complex branching and iteration and implement them as visual programs including variables.
Australian Curriculum
Content descriptions
Data representation AC9TDI6K03, AC9TDI6K04
Generating and designing AC9TDI6P02
Producing and implementing AC9TDI6P05
Related content and General capabilities
Mathematics: Number AC9M5N010, Algebra AC9M6A03
The Arts: AC9AVA6C01
Numeracy: Number patterns and algebraic thinking
Digital Literacy: Creating, Investigating
Critical and Creative Thinking
This topic enables students to
- describe ways that digital systems use numerical representations for data including binary digits
- apply algorithmic thinking to encode images and investigate patterns
- use a spreadsheet to automate processes such as representing cells in colour using whole numbers or binary
- identify and describe data types
- implement programs using visual programming that use data types
- demonstrate that the choice of data type influences the operations that can be performed.
Watch this video for a quick overview of the unit and how to use its resources with your students.
Assessment View assessment advice
Achievement standards
Digital Technologies: Years 5-6
By the end of Year 6, students process data and show how digital systems represent data. They design algorithms involving complex branching and iteration and implement them as visual programs including variables.
Assessment tasks
Binary representation: symbols Binary Images – Code.org
Rubrics
Use these two rubrics to assess student skills, processes and knowledge.
Data representation using binary numbers and whole numbers
This rubric provides benchmarks for assessing different levels of:
- representing data using ones and zeros (binary)
- encoding and decoding using binary
- creativity and proficiency in using whole numbers to create pixel art.
Data types and operations
This rubric provides benchmarks for assessing different levels of complexity and proficiency in:
- levels of understanding of data types, specifically focusing on strings and numbers
- identifying data types and control structures, as well as understanding the role of variables in programming
- applying and using data types in programming tasks, particularly focusing on string and number data types
- using control structures, variables and user input in programming tasks, with emphasis on the progression from basic sequences to more advanced programs with complex branching, iteration and the use of variables.
Rubric: Data representation using binary numbers and whole numbers
| Knowledge of binary number system | has a limited understanding of representing data using ones and zeros | shows understanding of ones and zeros relating to scenarios that use on/off, such as switches | shows understanding of using ones and zeros to represent data and provides relevant examples to assist in their explanation | demonstrates understanding of using ones and zeros to represent data and provides relevant examples to assist in their explanation, and can explain how binary numbers are used in computer systems |
| Encoding and decoding using binary | decodes a series of steps that includes binary to create an image, but there are noticeable errors in the resulting image | demonstrates the ability to encode and decode step-by-step instructions (algorithm) that include binary to create an image with minimal errors or no errors | consistently encodes and decodes an algorithm that includes binary to create an image with no errors, and describes patterns in the algorithm that repeat | consistently encodes and decodes instructions that include binary to create an image, and includes ways to more effectively perform the task for example using algorithms with iteration (repeat steps) |
| Creative use of whole numbers to represent data as pixel art | creates an image of pixel art by manually colouring a printed grid using whole numbers to represent colours | creates an image of pixel art by representing colours with numbers and manually colouring each individual cell in a digital grid | creates an image of pixel art using a spreadsheet, where colours are represented by numbers, and uses features such as copy and paste to colour each individual cell | creates an image of pixel art using a spreadsheet representing colours by numbers using conditional formatting, a form of branching to automate the colouring of each individual cell; incorporates representation of data using whole numbers in programming tasks involving complex branching, iteration and variables |
Rubric: Data types and operations
| Knowledge of data types (strings and numbers) | has a limited understanding of different data types | shows understanding of either strings or numbers as data types | shows understanding of strings and numbers as data types and provides relevant examples to support understanding | explains that the data type used to represent data determines the operations that can be performed on that data; provides relevant examples to illustrate how different data types enable specific operations |
| Identification of data types: Identifies control structures (sequence, branching and iteration), variables and input | misidentifies data types in given examples, and is not able to interpret the sequence of steps | accurately identifies most data types in provided examples; interprets the sequence of steps and identifies user input, branching or iteration | consistently identifies data types correctly in various examples; interprets the sequence of steps and identifies user input, branching and iteration | demonstrates a high level of accuracy in identifying data types; interprets the sequence of steps and identifies user input, branching and iteration; explains ways a variable serves as a 'container' to hold and manipulate different data types within a program |
| Applying and using data types in programming tasks | uses a simple string in a programming task but shows limited understanding of its usage | applies basic use of string and number data types in programming tasks, however, may seek guidance in determining when to use string concatenation (joining strings) versus using operators for number data types | applies the use of string and number data types in programming tasks and displays an understanding of when and how to apply them appropriately; differentiates between joining strings (concatenation) and using operators for number data types effectively | consistently applies a wide range of data types skilfully in programming tasks, demonstrating an advanced understanding of their usage and benefits; effectively chooses and implements the appropriate data types for specific programming scenarios, including strings and numbers |
| Using control structures (sequence, branching and iteration), variables and input in programming tasks | creates a program with user input in a sequence of logical steps to perform a basic task | creates a program with user input in a sequence of logical steps that includes a decision (branching) to provide the user with a choice | creates a program with user input in a sequence of logical steps that includes multiple decisions (complex branching) and iteration (repeat steps) | creates a program with multiple user input in a sequence of logical steps that includes multiple decisions (complex branching) and iteration (repeat steps); includes the use of variables to hold and manipulate different data types within a program |
Unit sequence
This topic offers 3 sequential units
Unit 1
Data representation using binary
Students encode and decode an image using ones and zeros.Unit 2
Creativity with automated pixel art
Students explore pixel images and use algorithms to generate patterns by repeating specific instructions involving binary.Unit 3
Data types and operations
Students learn about data types (numbers and strings) and create computer programs that use these data types.Data representation using binary
What is this about?
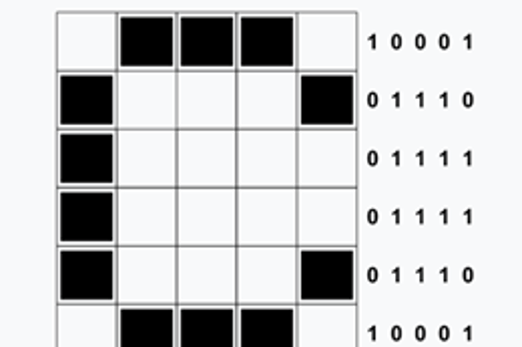
Digital systems, like computers, represent information using binary digits, ones and zeros. The term ‘binary’ refers to the use of only two values such as two digits or two states: on/off. Computer screens display images as grids of pixels, which are tiny, coloured squares. Exploring binary numbers through pixel-based image creation helps students understand the purpose and functionality of binary. With a single binary digit (one bit ), we can only represent two values. So, using one bit to represent a pixel's colour means each pixel can only have one of two possible colours. There are efficient ways of encoding an image in binary, such as run-length encoding.
Content description
Explore how data can be represented by off and on states (zeros and ones in binary) AC9TDI6K04
This sequence enables students to:
- use one bit to represent the colour of a single pixel
- encode and decode an image using ones and zeros
- use a spreadsheet to automate a process to encode cells in a grid to create an image
- apply knowledge of binary to other contexts, for example, on/off switches.
Resources to include
Resources to introduce
-

Binary representation activity
Find out more -
Colour by numbers – CS Unplugged
Find out more -
Binary Acknowledgement of Country
Find out more -
Squeezing pictures into less space
Find out more
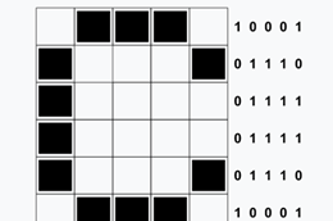
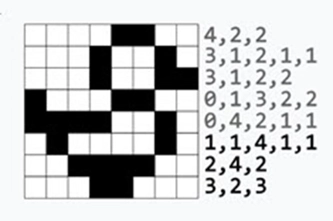
Years 5–6 Binary representation activity
Use this unplugged lesson to encode/decode an image using a ‘binary alphabet’ using two values such as letters or numbers.
Requires
- printed sheets or cards (documents provided)
Suggested time
1 hourEnables students to:
- encode and decode an image using a 'binary alphabet' using two values such as letters or numbers.
Years 5–6 Colour by numbers – CS Unplugged
Use this lesson to introduce a pixel and coding a grid using zeros and ones.
Requires
- printed sheets or cards (documents provided)
Suggested time
2 hoursEnables students to:
- encode and decode an image made up of 1 bit per pixel using binary numbers ones and zeros
- explain how images can be stored and represented using digits.
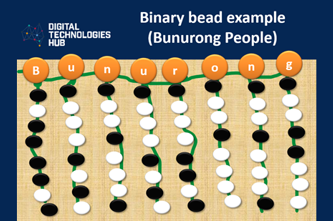
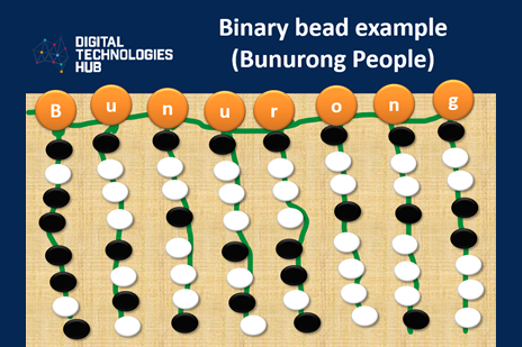
Years 5–6 Binary Acknowledgement of Country
In this learning sequence we explore data representation, learning about the way data in the form of text, can be represented in binary (on and off states). In using the context of Acknowledgement of Country we explore First Nations language groups written digitally as symbols and using a long thread of beads.
Requires
- internet access
- computers, laptops or tablets
Suggested time
2 hoursEnables students to:
- identify the local First Nations language group
- describe how text can be represented in binary
- represent the local First Nations language group in binary (on/off states).
Years 5–6 Squeezing pictures into less space
Use this lesson to introduce a pixel and code a grid using ones and zeros using run-length encoding.
Requires
- printed sheets or cards (documents provided)
Suggested time
1 hourEnables students to:
- encode and decode an image made up of 1 bit per pixel using binary numbers ones and zeros
- use run-length encoding and describe how this is a more efficient way of encoding
- explain how images can be stored and represented using digits.

Resources to develop and consolidate learning
-
Pixel art to binary – 1 bit
Find out more -
Black and white pixelation tutorial
Find out more -
Representing images using binary: totems
Find out more
Years 5–6 Pixel art to binary – 1 bit
Explore patterns using ones and zeros. Students share their binary code to decode.
Requires
- internet access
- computers, laptops or tablets
Suggested time
1 hourEnables students to:
- explain how binary numbers are used to create 1 bit per pixel images
- explain how images can be stored and represented using digits.
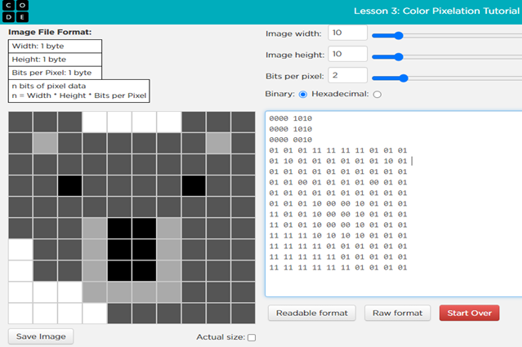
Years 5–6 Black and white pixelation tutorial
Explore creating black-and-white images using ones and zeros.
Requires
- internet access
- computers, laptops or tablets
Suggested time
1 hourEnables students to:
- explain how binary numbers are used to create 1 bit per pixel images
- describe how greyscale is used in 2 bit per pixel images
- explain that to represent the colour of each pixel in more colours other than black and white requires more numbers (for instance, more binary digits).
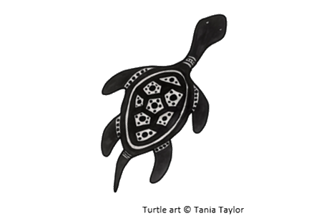
Years 5–6 Representing images using binary: totems
In this lesson, students will interpret a First Nations Australian artwork by representing an image they create as a binary image with accompanying code.
Requires
- internet access
- computers, laptops or tablet
- slides and worksheet (provided)
Suggested time
2 hoursEnables students to:
- explain how binary numbers are used to create 1 bit per pixel images
- explain that to represent the colour of each pixel in more colours other than black and white requires more numbers (for instance, more binary digits).

Resources to extend and integrate learning
-
Hour of code: Virtual pet
Find out more -
Flashing emotions
Find out more -
Home automation programming
Find out more


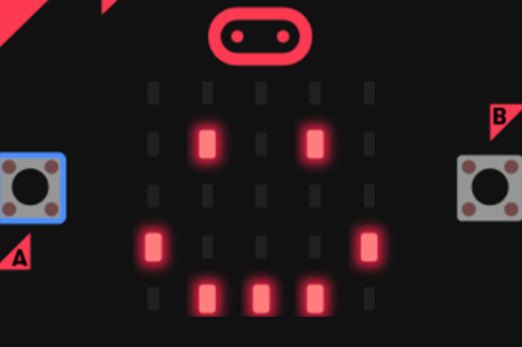
Years 5–6 Hour of code: Virtual pet
This tutorial shows how to use the 5 x 5 display of LEDs and the two buttons (A and B) of the micro:bit simulator in blockly code.
Requires
- register for free use of this tutorial and assign students to this task
- internet access
- computers, laptops or tablets
Suggested time
2 hoursEnables students to:
- describe how to create a program that turns LEDs on a micro:bit on and off
- explain their understanding of binary on/off switches.
Years 5–6 Flashing emotions
Create a program that turns on the LEDs in a micro:bit project.
Requires
- internet access
- computers, laptops or tablets
- physical micro:bit (optional)
Suggested time
1 hourEnables students to:
- describe how to create a program that turns LEDs on a micro:bit on and off
- explain their understanding of binary on/off switches.
Years 5–6 Home automation programming
Incorporate binary into programming using switching appliances on and off.
Requires
- computers, laptops or tablets
- access to Scratch 3.0 desktop version
Suggested time
2 hoursEnables students to:
- create a program that turns switches on and off.

Creativity with automated pixel art
What is this about?
Pixel art is a digital art form that uses small, distinct pixels arranged in a grid-like pattern to create images. Each pixel can be assigned 1 bit to represent an image in binary, for example, in black and white in binary with black = 0 and white = 1. As an extension, students can explore greyscale that uses 2 bits to represent an image allowing for four colour values.
Algorithms can be used to generate patterns by repeating specific instructions involving binary. For example, use iteration to repeat a set of instructions that turn pixels on or off in a specific pattern.
A spreadsheet can be used to automate design of pixel art. As an alternative, instead of using binary, students could use whole numbers to represent colours in their spreadsheet, for example, red = 1, blue = 2, yellow = 3.
Content descriptions
Explore how data can be represented by off and on states (zeros and ones in binary) AC9TDI6K04
Explain how digital systems represent all data using numbers AC9TDI6K03
Design algorithms involving multiple alternatives (branching) and iteration AC9TDI6P02
Implement algorithms as visual programs involving control structures, variables and input AC9TDI6P05
This sequence enables students to:
- use 1 bit to represent the colour of a single pixel
- encode an image using binary or whole numbers
- create pixel art using conditional formatting in a spreadsheet
- generate visual patterns by repeating specific instructions using ones and zeros.
Resources to include
Resources to introduce
Years 5–6 Pixel art series
Use these examples of Pixel Art to inspire students to create and design their own pixel art.
Requires
- internet access
- computers, laptops or tablets, or alternatively view as a class on an interactive whiteboard
Suggested time
1 hourEnables students to:
- describe how to create pixel art.
Resources to develop and consolidate learning
Years 5–6 Artist binary
Generate visual patterns by repeating specific instructions that include a string of binary numbers.
Requires
- internet access
- computers, laptops or tablets
Suggested time
1 hourEnables students to:
- describe how to create visual patterns using repeated steps that include strings of binary numbers.
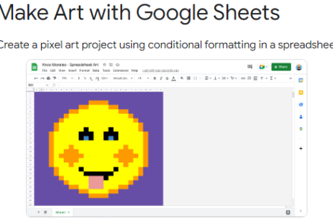
Years 5–6 Make art with Google sheet
Create a pixel art project using conditional formatting in a spreadsheet. Represent colours using whole numbers, for example, Yellow = 1.
Requires
- internet access
- computers, laptops or tablets
- spreadsheet software (for example, Excel, Sheets, Numbers)
Suggested time
2 hoursEnables students to:
- create pixel art using conditional formatting in a spreadsheet
- represent data using numbers.

Resources to apply and extend learning

Years 5–6 AI and image recognition
Incorporate a spreadsheet to create images using zeros and ones.
Requires
- internet access
- computers, laptops or tablets
- spreadsheet software (for example, Excel, Sheets, Numbers)
Suggested time
2 hoursEnables students to:
- use conditional formatting to automate the filling of cells based on a value.
Data types and operations
What is it about?
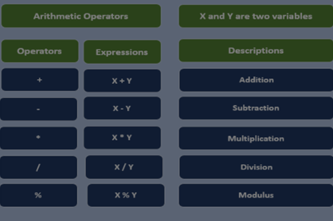
In digital systems, data types define how information is represented internally and the operations that can be performed on it. Numbers are a data type. We can use operators such as (+) for addition, (-) for subtraction, (*) for multiplication and (/) for division.
A string is another common data type used to represent a sequence of characters that can contain letters, numbers, symbols and spaces. Strings can be joined together (concatenation), merging them into a single string. Programming can be used to illustrate the concepts of data representation and the impact of data types on operations.
Content description
Explain how digital systems represent all data using numbers AC9TDI6K03
Design algorithms involving multiple alternatives (branching) and iteration AC9TDI6P02
Implement algorithms as visual programs involving control structures, variables and input AC9TDI6P05
This sequence enables students to:
- identify data types for example numbers and strings
- explain the types of operations performed on data types
- create computer programs that perform simple operations on data types.
Resources to include
Resources to introduce

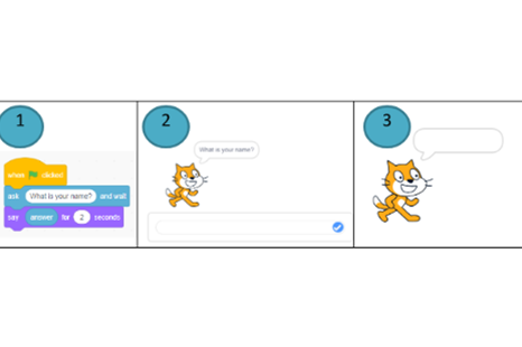
Years 5–6 CS in algebra: data types
Use this video to introduce data types.
Requires
- internet access
- computers, laptops or tablets, or alternatively view as a class on an interactive whiteboard
Suggested time
2 minutesEnables students to:
- identify data types, for example, numbers and strings.
Years 5–6 Unplugged: strings and numbers
Use this unplugged lesson to introduce data types.
Requires
- printed sheets or cards (documents provided)
Suggested time
1 hourEnables students to:
- identify data types, for example, numbers and strings
- explain the types of operations performed on data types.
Resources to develop and consolidate learning
-
Getting started with Scratch: Operators
Find out more -
Space
Find out more -
Lesson 2: Calculator
Find out more -
Lesson 5: password generator
Find out more

Years 5–6 Getting started with Scratch: Operators
This tutorial introduces operators with a programming example.
Requires
- free course, no registration required
- internet access
- computers, laptops or tablets
Suggested time
1 hourEnables students to:
- identify data types, for example, numbers and strings
- explain the types of operations performed on data types.
Years 5–6 Space
This tutorial uses visual programming examples to introduce data types, strings and numbers.
Requires
- register for free use of this tutorial and assign students to this task
- internet access
- computers, laptops or tablets
Suggested time
2 hoursEnables students to:
- identify data types, for example, numbers and strings
- explain the types of operations performed on data types.
Years 5–6 Lesson 2: Calculator
Use the visual programming examples to show how to make decisions (branching), include a variable and incorporate data types.
Requires
- free course, no registration required
- internet access
- computers, laptops or tablets
Suggested time
2 hoursEnables students to:
- identify data types, for example, numbers and strings
- explain the types of operations performed on data types.
Years 5–6 Lesson 5: password generator
Use this lesson to introduce variables and incorporate data types, strings and numbers, to create a password generator.
Requires
- free course (no registration required)
Suggested time
2 hoursEnables students to:
- identify data types for example numbers and strings
- explain the types of operations performed on data types.

Resources to apply and extend learning
-
DT Challenge: Blockly Chatbot
Find out more -
Can a computer recognise your sentiment?
Find out more -
Scratch: Maths rule
Find out more

Years 5–6 DT Challenge: Blockly Chatbot
Write code using data types to create word games and develop a Pirate Chatbot.
Requires
- register for free use of this tutorial and assign students to this task
- internet access
- computers, laptops or tablets
Suggested time
3 hoursEnables students to:
- identify data types, for example, numbers and strings
- explain the types of operations performed on data types.
Years 5–6 Can a computer recognise your sentiment?
This lesson plan enables students to explore operators and strings to assess and categorise a user’s online comments.
Requires
- internet access
- computers, laptops or tablets
Suggested time
3 hoursEnables students to:
- identify data types, for example, numbers and strings
- explain the types of operations performed on data types.

Years 5–6 Scratch: Maths rule
Students can modify and remix this Scratch program example to create function machines that use the data type numbers, performs operations, and includes variables and repeat blocks.
Requires
- internet access
- computers, laptops or tablets, or alternatively view as a class on an interactive whiteboard
Suggested time
2 hoursEnables students to:
- identify data types, for example, numbers and strings
- explain the types of operations performed on data types.
Further reading and professional learning
-
Operator blocks
Find out more -
Learn-Scratch-05.pdf
Find out more -
Techclass4kids: Operators in scratch
Find out more

Years 5–6 Operator blocks
This blog explains the use of operators with relevant examples for students to use in their visual programs.
Suggested time
30 minutes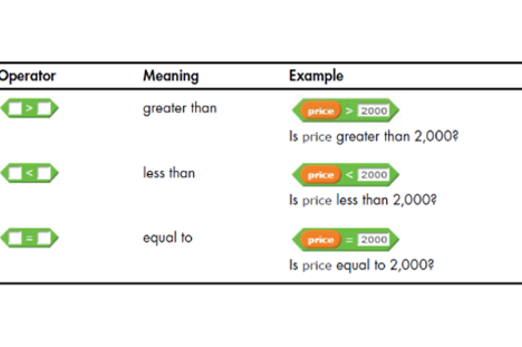
Years 5–6 Learn-Scratch-05.pdf
Background for Scratch programming. Scratch has built-in support for three data types that you can use in blocks: Booleans, numbers and strings.
Suggested time
30 minutes
Years 5–6 Techclass4kids: Operators in scratch
This blog explains the use of operators with relevant examples for students to use in their visual programs.
Suggested time
30 minutes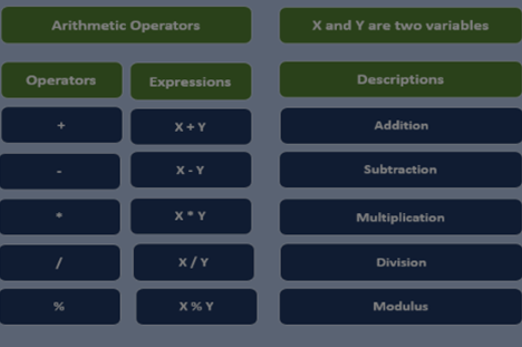
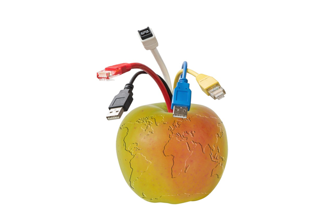
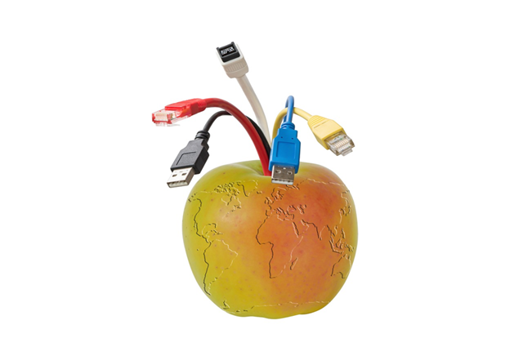
Digital systems, safety and security
Overview
This unit explores the internal components of a digital device and their function. It explores computers connected via networks and how to use safe behaviours in a digital world.
Achievement standards
Students securely access and use multiple digital systems and describe their components and how they interact to process and transmit data.
They identify their digital footprint and recognise its permanence.
Australian Curriculum
Content descriptions
Digital systems AC9TDI6K01, AC9TDI6K02
Privacy and security AC9TDI6P09
Related content and General capabilities
Digital Literacy: Practising digital safety and wellbeing, Select and operate tools, Protect content
Critical and Creative Thinking
This topic enables students to
- name devices on a computer network
- describe how devices in a network are connected
- identify networked devices at school or home
- describe the benefits of computer networks
- describe ways they use safe practices when accessing apps and websites.
Watch this video for a quick overview of the unit and how to use its resources with your students.
Assessment View assessment advice
Achievement standards
Digital Technologies: Years 5-6
By the end of Year 6, students securely access and use multiple digital systems and describe their components and how they interact to process and transmit data. They identify their digital footprint and recognise its permanence.
Assessment tasks
- Informal teacher assessment of pupils during main task and plenary. Focus on understanding the different network devices and their roles.
- Formal assessment of pupils’ sketch maps indicating devices identified and details of their role within the network.
Using Digital systems: School network, students create a concept map or mind map that demonstrates what they know about digital systems, how different components are connected and the role they play, using the school network as an example.
This annotated work sample, School networks, demonstrates a satisfactory response to explaining how a school network operates.
Rubric
| Understanding system components | with guidance, identifies some parts of a digital system but needs directing to explain their specific purpose | explains at a basic level how digital systems are made up of many parts, each with a specific purpose | explains how individual components of a digital system work together to perform a function, providing clear and relevant examples | demonstrates a comprehensive understanding of how individual components work together, offering detailed explanations and examples of system interactions |
| Security requirements | with guidance, shows some awareness of security requirements for accessing digital systems | identifies basic security requirements, such as passwords, for accessing digital systems | points out specific security requirements (e.g., domain names) for accessing a digital system on a school network | explains and applies security practices, including domain names, network permissions, and authentication methods, to ensure secure access to school networks |
| Connecting to local area networks (LANs) | with guidance, identifies some of steps to connect to a local area network but needs to be directed to complete the process | describes the basic steps required to connect to a local area network and connects with minimal guidance | demonstrates the steps required to connect to an appropriate local area network (LAN) within a school setting | independently performs and explains steps required to connect to a local area network (LAN) within a school, and considers security and network settings |
| Identifying and describing digital footprint | with guidance, suggests basic examples of a digital footprint | describes what a digital footprint is with some examples of sites or activities that contribute to their digital footprint | explains how a digital footprint is created, with relevant examples and explains that it is permanent or can be tracked | explains what a digital footprint is, provides detailed examples of sites or actions that contribute to their footprint, and discusses the long-term impact and permanence of a digital footprint on privacy and reputation |
Unit sequence
This topic offers 3 sequential units
Unit 1
Inside a computer
Students explore the main internal components of common digital systems and their function.Unit 2
Connected via a network
Students investigate familiar networks to learn about the function of the following components: network cable, hub, server, router.Unit 3
Using digital systems safely and securely
Students investigate what information can be safely shared online and describe protocols of sharing information online.Inside a computer
What is this about?
Digital devices, such as computers, need both physical parts (hardware) and instructions (software) to work. They require power, user input and an operating system to perform tasks. The operating system connects the software and hardware. The main parts that process and store data in a digital device are the Central Processing Unit (CPU) and memory storage. Learning about hardware and software helps students understand how technology works, enabling them to navigate and use it effectively.
Content description
Investigate the main internal components of common digital systems and their function AC9TDI6K01
This sequence enables students to:
- recognise that a digital device is made up of several parts
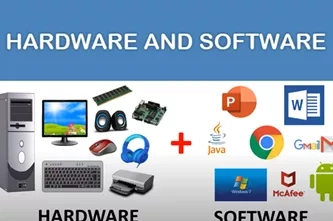
- identify hardware and software components of digital devices
- describe the role of hardware and software components of digital devices.
Supplementary information
In the previous year band, students learned about peripherals and developed their knowledge of the relationship between inputs, processes and outputs of a digital device.
An important part of digital literacy is to learn how to use different software applications, navigate operating systems, manage files and folders, and perform basic computer tasks.
Resources to include
Resources to introduce
-
How computers work: Hardware and software
Find out more -
How computers work: What makes a computer, a computer?
Find out more -
Hardware software – Camp coding camp
Find out more


Years 5–6 How computers work: Hardware and software
Use this video to understand the role of internal components – such as CPU and memory – have in a computer.
Requires
- internet access
- computers, laptops or tablets, or a whiteboard to view as a class
Suggested time
5 minutesEnables students to:
- identify hardware and software components of digital devices
- describe the role of hardware and software components of digital devices.
Years 5–6 How computers work: What makes a computer, a computer?
Use this video to discover the features that all computers share.
Requires
- internet access
- computers, laptops or tablets, or a whiteboard to view as a class
Suggested time
5 minutesEnables students to:
- identify hardware and software components of digital devices
- describe the role of hardware and software components of digital devices.
Years 5–6 Hardware software – Camp coding camp
This video uses a fun rap song to engage students in learning about hardware and software in a computer.
Requires
- internet access
- computers, laptops or tablets, or a whiteboard to view as a class
Suggested time
3 minutesEnables students to:
- identify hardware and software components of digital devices
- describe the role of hardware and software components of digital devices.
Resources to develop and consolidate learning
-
Inside your computer – Bettina Bair
Find out more -
How computers work
Find out more -
How computers work: CPU, memory, input & output
Find out more -
Computer hardware and software: Computer fundamentals for children
Find out more


Years 5–6 Inside your computer – Bettina Bair
Use this video to provide a guide about what happens when you interact with your computer via a mouse.
Requires
- internet access
- computers, laptops or tablets
Suggested time
4 minutesEnables students to:
- identify hardware and software components of digital devices
- describe the role of hardware and software components of digital devices.

Years 5–6 How computers work
Use this unplugged activity to give the students a sense of how computers work by having them act out a simple computer simulation.
Requires
- Printed sheets or cards (documents provided)
Suggested time
1 hourEnables students to:
- identify hardware and software components of digital devices
- describe the role of hardware and software components of digital devices.

Years 5–6 How computers work: CPU, memory, input & output
This video explains the components that allow a computer to input, store, process, and output information.
Requires
- internet access
- computers, laptops or tablets
Suggested time
4 minutesEnables students to:
- identify hardware and software components of digital devices
- describe the role of hardware and software components of digital devices.
Years 5–6 Computer hardware and software: Computer fundamentals for children
Use this video to learn about hardware and software. It includes a quiz.
Requires
- internet access
- computers, laptops or tablets, or a whiteboard to view as a class
Suggested time
3 minutesEnables students to:
- identify hardware and software components of digital devices
- describe the role of hardware and software components of digital devices.

Resources to extend and integrate learning
Years 5–6 Difference between hardware and software
Use this quiz to learn about the differences between software and hardware.
Requires
- internet access
- computers, laptops or tablets, or a whiteboard to view as a class
Suggested time
30 minutesEnables students to:
- identify hardware and software components of digital devices
- describe the role of hardware and software components of digital devices.
Further reading and professional learning

Years 5–6 Computing theory for 7–11 year olds
This resource for teachers is a useful background to digital technologies taught in primary schools.
Suggested time
30 minutes
Connected via a network
What is this about?
Many digital devices are connected to other digital devices, such as computers via cables, tablets and laptops via wi-fi, and smartphones via mobile phone networks. Connecting digital devices allows information to be shared between users and systems. A network can be small, connecting devices within a limited area like a home or office, or as vast as the internet, which connects millions of devices worldwide. A network is made up of components including network cables, hubs, servers and routers, each carrying out key functions.
By learning about networks, students gain a fundamental understanding of how data moves between devices, systems and users. They see the significance of global connectivity and how it has transformed the way people shop, stream content, interact, work and learn.
Content description
Examine how digital systems form networks to transmit data AC9TDI6K02
This sequence enables students to:
- identify and describe familiar networks around them
- describe how devices in a network are connected to transmit data
- identify the benefits of computer networks
- discuss why a network needs protecting
- understand that the internet is a network of networks.
Resources to include
Resources to introduce
-
The orange game
Find out more -
Computer networks: email example
Find out more -
A packet's tale: How does the internet work?
Find out more -
What is the internet?
Find out more -
The story of wi-fi
Find out more


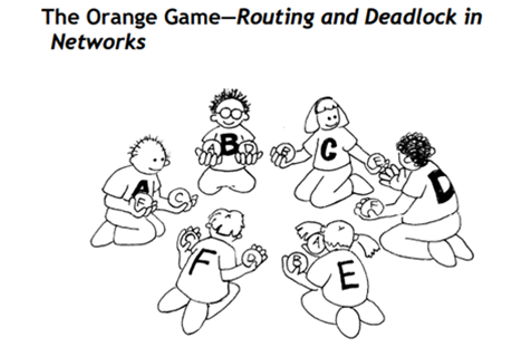
Years 5–6 The orange game
Use this unplugged activity to discuss a deadlock when messages are sent via the internet. A video demonstration is also available.
Requires
- two oranges or tennis balls per student
- a name tag or sticker per student
Suggested time
1 hourEnables students to:
- describe how devices in a network are connected to transmit data.
Years 5–6 Computer networks: email example
Use this series of slides to introduce the concept of connections and moving information between connected devices.
Requires
- laptops and interactive whiteboard to share slides
Suggested time
1 hourEnables students to:
- describe how devices in a network are connected to transmit data
- identify the benefits of computer networks.

Years 5–6 A packet's tale: How does the internet work?
Use this video to explore how information travels across the internet, and introduce the concept of packet switching.
Requires
- internet access
- computers, laptops or tablets, or a whiteboard to view as a class
Suggested time
3 minutesEnables students to:
- describe the concept of breaking data down into packets for transmission across networks.

Years 5–6 What is the internet?
This video provides an opportunity to discuss the internet and what it is.
Requires
- internet access
- computers, laptops or tablets, or a whiteboard to view as a class
Suggested time
4 minutesEnables students to:
- describe how devices in a network are connected together to transmit data
- explain how a global network of interconnected computer networks enables the exchange of information and communication among users worldwide.

Years 5–6 The story of wi-fi
This article and supporting video show how a team of Australian radio astronomers solved the problem of high-speed wireless internet.
Requires
- internet access
- computers, laptops or tablets, or a whiteboard to view as a class
Suggested time
12 minutesEnables students to:
- describe how devices in a network are connected together to transmit data
- describe how electronic devices connect to the internet or communicate with each other wirelessly using radio waves.

Resources to develop and consolidate learning
-
The internet
Find out more -
Networking hardware
Find out more -
What does our school network look like?
Find out more


Years 5–6 The internet
This lesson explores the internet and its uses. It includes explainer videos including about the internet and its history, and how messages can be successfully sent from one device to another across the planet in under a second using packets and IP addresses.
Requires
- internet access
- computers, laptops or tablets
- electronic whiteboard to display video to class
Suggested time
1 hourEnables students to:
- describe the internet as a network of networks
- demonstrate how information is shared across the internet
- discuss why a network needs protecting.

Years 5–6 Networking hardware
This lesson explores the functionality of key hardware components found in a network. It covers network cables, hubs, servers and routers.
Requires
- internet access
- computers, laptops or tablets
- printed worksheet supplied or electronic version of slides
Suggested time
1 hourEnables students to:
- describe the function of the following components found in computer networks: network cable, hub, server, router.

Years 5–6 What does our school network look like?
Use this resource to investigate the school network and learn about how computers are connected.
Requires
- internet access
- computers, laptops or tablets
- printed worksheet supplied or electronic version of slides
Suggested time
1 hourEnables students to:
- describe the function of the following components found in computer networks: network cable, hub, server, router
- explain how the individual components of a digital system work together to perform a function.
Resources to apply and extend learning
Years 5–6 Connectivity at home
Use this take-home activity for students to investigate different forms of connectivity and discover which types can be paired with the digital systems their family owns.
Requires
- printed worksheet supplied or electronic version of slides
Suggested time
1 hourEnables students to:
- identify and describe familiar networks around them.
Further reading and professional learning
Using digital systems safely and securely
What is it about?
Students engage in online information sharing through the development of digital solutions and ensure safe interaction by adhering to suitable digital system protocols and agreed-on behaviours. They receive ongoing guidance from trusted adults to become aware of potential risks when working both independently and in collaboration. Additionally, students delve into the ways online applications and networked systems handle their data and explore methods to control their online presence.
Content descriptions
Explain how digital systems represent all data using numbers AC9TDI6K03
Access multiple personal accounts using unique passphrases and explain the risks of password re-use AC9TDI6P09
This sequence enables students to:
- identify strategies to protect content and personal information when accessing online websites by setting appropriate access controls
- explain what information can be safely shared online and describe protocols of sharing information online
- explain how to use passphrases safely and securely
- describe ways to be a responsible user in an online environment
- describe ways to protect your personal information and how it may be at risk.
Resources to include
Resources to introduce
-
Be secure
Find out more -
How secure is my password?
Find out more -
Set secure passphrases
Find out more -
eSafety – First Nations: Connecting safely
Find out more


Years 5–6 Be secure
Use this video to discuss basic online safety skills, including why it is essential to Ask, Check and Think before acting in the digital world.
Requires
- internet access
- computers, laptops or tablets to view the video
Suggested time
1 hourEnables students to:
- identify and establish personal online safety boundaries
- develop skills to question what they encounter online
- develop skills to identify problematic situations which may impact their online safety or security
- consider appropriate help seeking and reporting strategies for dealing with unsafe situations online.

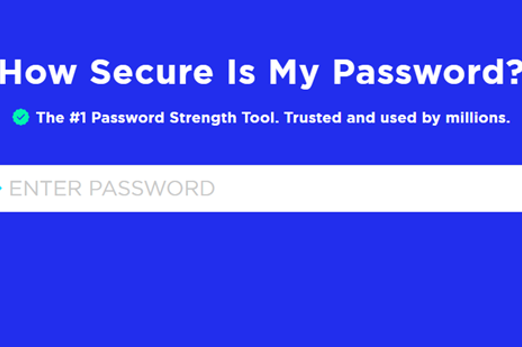
Years 5–6 How secure is my password?
Use this online tool to help students better understand password security.
Requires
- internet access
- computers, laptops or tablets
Suggested time
30 minutesEnables students to:
- protect content and personal information when accessing online websites by setting appropriate access controls.
Years 5–6 Set secure passphrases
Students learn about passphrases that are harder to guess but easy to remember. Includes a quiz.
Requires
- internet access
- computers, laptops or tablets
Suggested time
1 hourEnables students to:
- protect content and personal information when accessing online websites by setting appropriate access controls.
Years 5–6 eSafety – First Nations: Connecting safely
Guidance and tips about staying safe online for First Nations students.
Requires
- internet access
- computers, laptops or tablets
Suggested time
1 hourEnables students to:
- protect content and personal information when accessing online websites by setting appropriate access controls.

Resources to develop and consolidate learning
-
Cybersmart Challenge
Find out more -
Cybermarvel – Primary
Find out more -
Protecting your personally identifiable information
Find out more -
Cyber security same: Know your risks
Find out more -
Digital footprint
Find out more


Years 5–6 Cybersmart Challenge
Watch these videos and find out how to be smart online. Use the videos to introduce students to key online safety issues including cyberbullying, protecting personal information and sharing images.
Requires
- internet access
- computers, laptops or tablets to view the video
Suggested time
1 hourEnables students to:
- identify how to safely share content/images online
- identify what personal information is safe to put online
- identify what cyberbullying is.

Years 5–6 Cybermarvel – Primary
An introduction to cyber security with four modules on offer.
Requires
- internet access
- computers, laptops or tablets
- free Grok learning accounts
Suggested time
4 hoursEnables students to:
- explain what information can be safely shared online and describe protocols of sharing information online
- explain how to use passwords safely and securely
- describe ways to protect your personal information and how it may be at risk.
Years 5–6 Protecting your personally identifiable information
This website provides the key information about being safe online.
Requires
- internet access
- computers, laptops or tablets
Suggested time
30 minutesEnables students to:
- explain what information can be safely shared online and describe protocols of sharing information online.

Years 5–6 Cyber security same: Know your risks
What information is safe to share online? This interactive (PowerPoint) classroom presentation can help students understand the risks.
Requires
- internet access
- computers, laptops or tablet
- access to slides provided
Suggested time
1 hourEnables students to:
- explain what information can be safely shared online and describe protocols of sharing information online.

Years 5–6 Digital footprint
Use this website to explore the trail of data, known as your digital footprint.
Requires
- internet access
- computers, laptops or tablets
Suggested time
30 minutesEnables students to:
- describe data that is created from your online activities
- describe ways to protect your personal information and how it may be at risk.

Resources to apply and extend learning
-
Cracking a code – give your passwords superpowers
Find out more -
Password generator
Find out more -
Making good choices online
Find out more -
Smartphone security
Find out more


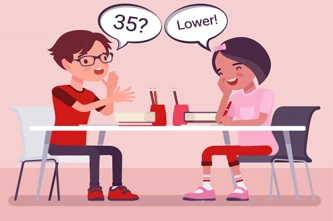
Years 5–6 Cracking a code – give your passwords superpowers
Play a game with a partner where you guess a three-digit code. This task can be done as a take-home activity.
Requires
- printed worksheets
Suggested time
1 hourEnables students to:
- explain how to use passwords safely and securely.

Years 5–6 Password generator
Use this lesson to introduce variables and incorporate data types, strings and numbers, to create a password generator.
Requires
- free course, no registration required
- internet access
- computers, laptops or tablets
Suggested time
2 hoursEnables students to:
- explain how to use passwords safely and securely
- identify data types; for example, numbers and strings.
Years 5–6 Making good choices online
This lesson explores three different scenarios asking students to decide what the character should do in each online situation using the think, evaluate, choose (TEC) model.
Requires
- internet access
- computers, laptops or tablets
- electronic whiteboard to view slides as a class
Suggested time
1 hourEnables students to:
- describe ways to be a responsible user in an online environment
- understand the need to discuss choices with a trusted adult.

Years 5–6 Smartphone security
This lesson provides an opportunity to investigate security measures, including those powered by artificial intelligence (AI), that are used to protect users from unauthorised (unapproved, unwanted) access to their digital devices.
Requires
- internet access
- computers, laptops or tablets
- access to Scratch
Suggested time
1–2 hoursEnables students to:
- describe ways to protect use of digital devices using passphrases or biometric security
- create a program using a visual programming language that protects the user against unauthorised access.

Further reading and professional learning
Years 5–6 Privacy and security infographic (F-10)
Explore privacy and security for your Year band.
Suggested time
30 mins
Programming challenges
Overview
This unit provides a sequence for teaching programming incorporating branching, iteration (repetition) and variables.
Achievement standards
Digital Technologies: Years 5–6
By the end of Year 6 students design algorithms involving complex branching and iteration and implement them as visual programs including variables.
Australian Curriculum
Content descriptions
Generating and designing AC9TDI6P02
Producing and implementing AC9TDI6P05
Related content and General Capabilities
Related content:
- Mathematics
- The Arts
- Health and Physical Education
General capability: Critical and Creative Thinking
Cross-curriculum priority: Sustainability
This topic enables students to
- follow algorithms to determine their purpose and predict outcomes
- describe and create an algorithm that includes branching and repetition
- create a program following an algorithm that includes branching and repetition
- incorporate variables into a program that uses a repeat command and includes decisions that enable the user to choose different paths.
Watch this video for a quick overview of the unit and how to use its resources with your students.
Assessment View assessment advice
Achievement standards
Digital Technologies: Years 5-6
By the end of Year 6 students design algorithms involving complex branching and iteration and implement them as visual programs including variables.
Assessment tasks
Use this assessment task All at sea for Year 5–6 that assesses programming (AC:DT V8.4)
Rubric
Use this rubric to assess student skills, processes and knowledge.
Control structures (branching and iteration)
This rubric provides benchmarks for assessing different levels of complexity and proficiency in:
- levels of understanding of programming blocks, specifically focusing on control structures
- identifying control structures, as well as understanding the role of variables in programming
- using control structures, variables and user input in programming tasks.
Rubric: Control structures (branching and iteration)
By the end of Year 6, students design algorithms involving complex branching and iteration, and implement them as visual programs including variables.
| Knowledge of visual programming blocks | demonstrates a limited understanding of visual programming blocks | can name some visual programming blocks or describe their purpose | describes the purpose of the visual programming blocks and provides relevant examples to support their understanding | explains how programming blocks are organised by type, their purpose and provides relevant examples to support their understanding. Their examples illustrate blocks to enable input, decisions, repeat steps and data stored as a variable |
| Identifies control structures: investigating sample visual programs | demonstrates limited ability to describe or identify blocks in given examples and interpret the sequence of steps | identifies most block types in provided examples. Interprets the sequence of steps and identifies user input, decisions (branching) or repeat steps (iteration) | consistently identifies block types correctly in various examples. Interprets the sequence of steps, predicts outcomes of blocks and identifies user input, decisions (branching) and repeat steps (iteration) | demonstrates a high level of accuracy in identifying block types of a range of complex visual programs. Interprets the sequence of steps, predicts outcomes of blocks and identifies user input, branching and iteration. Explains ways a variable serves as a 'container' to hold and manipulate different data types within a program |
| Producing and implementing visual programs | with guidance, creates a program in a sequence of steps to perform a basic task with limited opportunity for user input | creates a program with user input in a sequence of logical steps that includes a decision (branching) to provide the user with a choice | creates a program with user input in a sequence of logical steps that includes multiple decisions (complex branching) and iteration (repeat steps) | creates a program with multiple user input in a sequence of logical steps that includes multiple decisions (complex branching) and iteration (repeat steps). Includes the use of variables to hold and manipulate different data types within a program |
Unit sequence
This topic offers 3 sequential units
Unit 1
Algorithms
Students draw on computational thinking to follow and design algorithms with branching and repetition.Unit 2
Branching and iteration
Students implement algorithms as visual programs involving branching, iteration, variables and input.Unit 3
Introducing variables
Students learn about variable and implement these in their visual programs.Algorithms
What is this about?
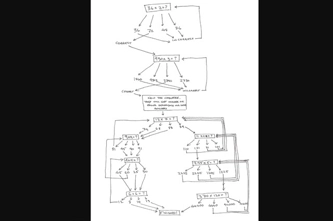
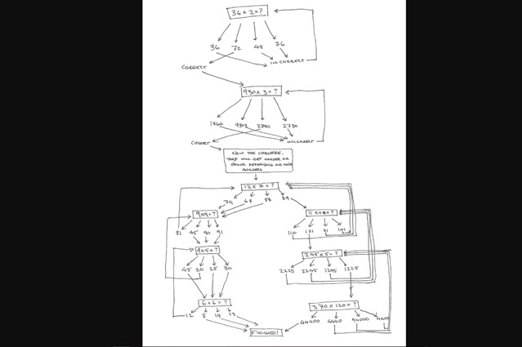
Following and designing algorithms with branching and repetition draws on students’ problem-solving skills. They break down complex tasks, identify patterns and create efficient solutions using If/then statements and loops to improve efficiencies. Students analyse problems, consider possibilities and design suitable solutions as an algorithm first. An algorithm can be written as a series of steps or diagrammatically such as in a flowchart. The algorithm can then be implemented as a computer program.
Content description
Design algorithms involving multiple alternatives (branching) and iteration AC9TDI6P02
This sequence enables students to:
- follow algorithms to determine their purpose and predict outcomes
- explain and debug algorithms
- understand the importance of the order of statements within algorithms
- identify repeating patterns and use loops to make their algorithms more concise
- use if/then statements to add control and decision-making to algorithms, including more than two decision paths.
Resources to include
Resources to introduce
-
coding@home TV – Primary 2 – Designing an algorithm
Find out more -
Number guessing: I’m thinking of a number...
Find out more

Years 5–6 coding@home TV – Primary 2 – Designing an algorithm
Use this video to introduce algorithms with branching and repetition (iteration).
Requires
- internet access
- computers, laptops or tablets, or an interactive whiteboard to view as a class
Suggested time
24 minutesEnables students to:
- describe an algorithm that includes branching and repetition.
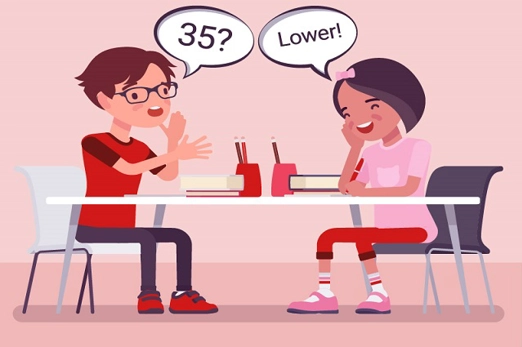
Years 5–6 Number guessing: I’m thinking of a number...
Play a number guessing game to explore algorithms.
Requires
- printed worksheets supplied
Suggested time
1 hourEnables students to:
- describe an algorithm that includes branching and repetition.
Resources to develop and consolidate learning
Years 5–6 Learning to loop
Students create algorithms with a condition that tells the computer to repeat a sequence of instructions.
Requires
- internet access
- computers, laptops or tablets
Suggested time
1 hourEnables students to:
- describe an algorithm that includes repetition
- create an algorithm that includes repetition.
Years 5–6 Making maths quizzes 1: Plan and test our programs
In this sequence of lessons students plan, create and edit a program that will ask maths questions that are harder or easier depending on user performance.
Requires
- internet access
- computer/laptop and interactive whiteboard
- large sheets of paper for recording ideas
Suggested time
1 hourEnables students to:
- describe an algorithm that includes branching and repetition
- create an algorithm that includes branching and repetition.
Resources to extend and integrate learning

Years 5–6 Eco-calculator
Students will make a paper prototype of an eco-calculator to demonstrate human impact on the environment and suggest changes in behaviour.
Requires
- large sheets of paper for recording
Suggested time
2 hoursEnables students to:
- describe an algorithm that includes repetition
- create an algorithm that includes repetition.

Further reading and professional learning

Years 5–6 Algorithms infographic: Years 3-6
Use this infographic as a guide to view ways algorithms are covered for Years 3–6.
Suggested time
30 minutes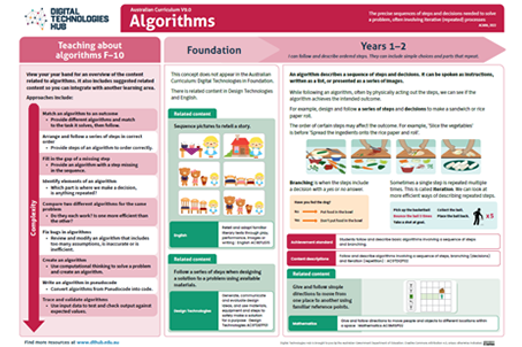
Branching and iteration
What is this about?
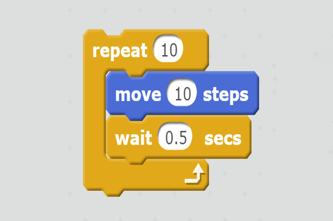
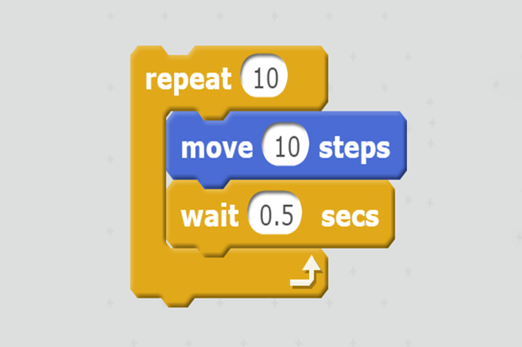
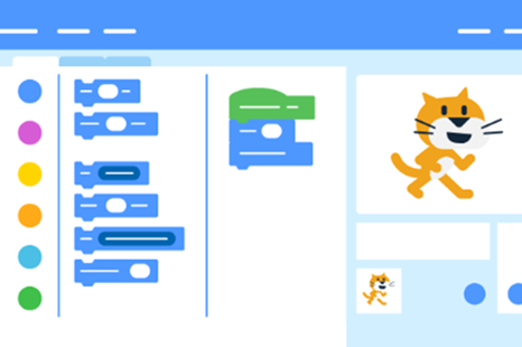
The sequence and flow of a program is determined by control structures such as branching or iteration (repetition). In a program, ‘if’ statements are branching control structures that allow for decisions that enable the user to choose different paths. Loops are iteration control structures that repeat instructions. These concepts are fundamental in programming across languages. Learning them in Scratch develops transferable skills for exploring new tools and languages. This unit predominantly uses Scratch; however teachers may substitute a similar visual programming language.
Content description
Implement algorithms as visual programs involving control structures, variables and input AC9TDI6P05
This sequence enables students to:
- identify and explain what repeat blocks do in a program
- create a program that uses a repeat command
- explain ways to provide decisions that enable the user to choose more than two different paths
- create a program that includes decisions that enable the user to choose more than two different paths.
Supplementary information
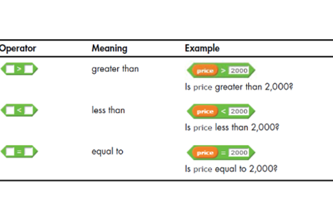
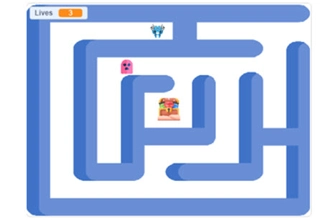
In Scratch, students learn if/then statements to control program flow. They use comparison operators (e.g. =, <, >). For example, ‘if light level < 100, turn the light on’. As their skills develop, introduce if/else statements for multiple decisions and alternative paths when conditions aren't met. To appreciate efficiency and convenience, students learn loops – a form of iteration. Teach conditional loops like ‘repeat until’, which execute once before checking the condition. For example, in game play, ‘repeat until lives = 0’.
Resources to include
Resources to introduce
-
Archery
Find out more -
coding@home TV – Primary 4 – Branching and repetition using Scratch
Find out more -
Making maths quizzes 2: Implementing a digital solution
Find out more -
Introduction to loops in Scratch – Barclays Code Playground
Find out more -
Introduction to conditionals in Scratch – Barclays Code Playground
Find out more
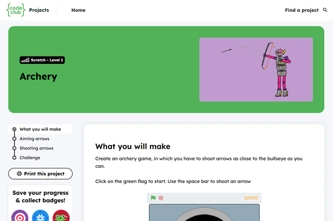

Years 5–6 Archery
Create an archery game, in which you have to shoot arrows as close to the bullseye as you can.
Suggested time
1 hour
Years 5–6 coding@home TV – Primary 4 – Branching and repetition using Scratch
Use this video to explain how to include branching and repetition to make a Scratch program more interactive and to give the user choices.
Requires
- internet access
- computers, laptops or tablets, or an interactive whiteboard to view as a class
Suggested time
24 minutesEnables students to:
- explain what the repeat blocks do in a program
- explain ways to provide decisions in a program that enable the user to choose different paths.
Years 5–6 Making maths quizzes 2: Implementing a digital solution
In this sequence of lessons, students implement a digital solution for a maths quiz.
Requires
- internet access
- computers, laptops or tablets
Suggested time
1 hourEnables students to:
- explain what the repeat blocks do in a program.
Years 5–6 Introduction to loops in Scratch – Barclays Code Playground
In this lesson students learn about loops (a form of iteration) through dance. Includes a video tutorial.
Requires
- computers. laptops or tablets
- access to Scratch 3.0 desktop version or similar visual programming language
Suggested time
1 hourEnables students to:
- explain what the repeat blocks do in a program
- explain ways to provide decisions in a program that enable the user to make a choice
- create a program following an algorithm that includes branching and iteration.

Years 5–6 Introduction to conditionals in Scratch – Barclays Code Playground
In this lesson students learn about conditional statements (branching) using the ‘Rock, paper scissors’ game. Includes a video tutorial.
Requires
- computers. laptops or tablets
- access to Scratch 3.0 desktop version or similar visual programming language
Suggested time
2 hoursEnables students to:
- explain what the repeat blocks do in a program
- explain ways to provide decisions in a program that enable the user to make a choice
- create a program following an algorithm that includes branching and iteration.
Resources to develop and consolidate learning
-
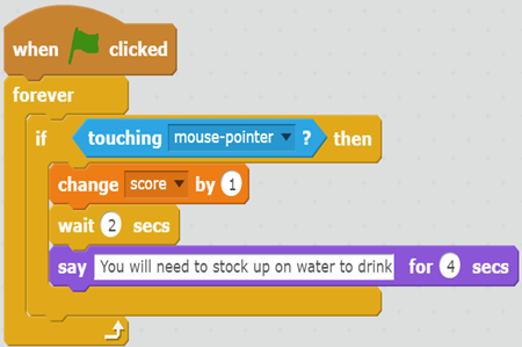
Weather watchers
Find out more -
Getting started with Scratch – Control
Find out more -
Storm survivor: Input, decision-making and loops
Find out more -
DT get looping: Scratch
Find out more
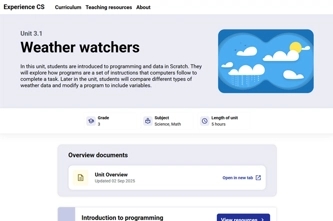


Years 5–6 Weather watchers
In this unit, students are introduced to programming and data in Scratch. They will explore how programs are a set of instructions that computers follow to complete a task. Later in the unit, students will compare different types of weather data and modify a program to include variables.
Suggested time
1 hour
Years 5–6 Getting started with Scratch – Control
This tutorial provides examples of how to use ‘control’ blocks, which control the order that blocks run in, including decisions (selection) and loops (repetition).
Requires
- computers. laptops or tablets
- access to Scratch 3.0 desktop version or similar visual programming language
Suggested time
1 hourEnables students to:
- describe how control blocks are used in programming
- describe ways to use conditions to make decisions
- describe ways to repeat parts of the program.
Years 5–6 Storm survivor: Input, decision-making and loops
Students use a visual programming language to create a game or quiz to help members of a community prepare for a severe weather event.
Requires
- computers. laptops or tablets
- access to Scratch 3.0 desktop version or similar visual programming language
Suggested time
1 hourEnables students to:
- explain what repeat blocks do in a program
- explain ways to provide decisions in a program that enable the user to make a choice
- create a program following an algorithm that includes branching and iteration.
Years 5–6 DT get looping: Scratch
In this short course, learn to use loops and variables in their Scratch projects.
Requires
- register for free use of this tutorial and assign students to this task
- internet access
- computers, laptops or tablets
Suggested time
2 hoursEnables students to:
- explain what the repeat blocks do in a program
- explain ways to provide decisions in a program that enable the user to make a choice
- create a program following an algorithm that includes branching and iteration.

Resources to apply and extend learning
-
Experience CS curriculum
Find out more -
Can a computer recognise your sentiment?
Find out more -
Microsoft Makecode arcade
Find out more

Years 5–6 Experience CS curriculum
Explore computational thinking through an intergrated approach making connections to a range of learning areas including maths, science and HASS.
Suggested time
4–6 hours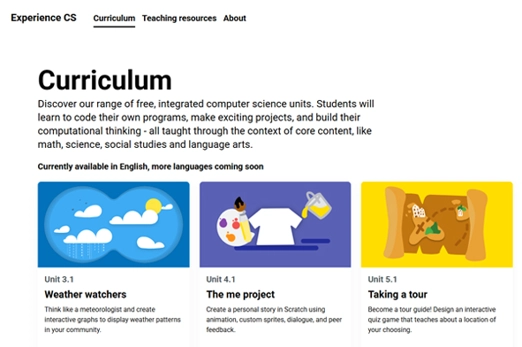
Years 5–6 Can a computer recognise your sentiment?
This lesson enables students to create a program with branching and iteration to show how Artificial Intelligence assesses and categorises a user’s online comments.
Requires
- computers. laptops or tablets
- access to Scratch 3.0 desktop version or similar visual programming language
Suggested time
2 hoursEnables students to:
- explain what repeat blocks do in a program
- explain ways to provide decisions in a program that enable the user to make a choice
- create a program following an algorithm that includes branching and iteration.
Years 5–6 Microsoft Makecode arcade
Choose arcade games to explore and remix. Follow a tutorial to get started.
Requires
- register for free use of this resource to save students versions of their games
- internet access
- computers, laptops or tablets
Suggested time
4–6 hoursEnables students to:
- explain what the repeat blocks do in a program
- explain ways to provide decisions in a program that enable the user to make a choice
- create a program that includes branching and iteration.

Further reading and professional learning


Introducing variables
What is it about?
Variables allow students to store and manipulate data within a computer program such as in a Scratch project. A variable can be used to represent different types of information, such as numbers or text, and store these values that change during program execution. They can update variables based on user input, events or calculations, which can affect the behaviour and appearance of sprites (on screen characters or objects).
Content descriptions
Design algorithms involving multiple alternatives (branching) and iteration AC9TDI6P02
Implement algorithms as visual programs involving control structures, variables and input AC9TDI6P05
This sequence enables students to:
- identify variables in a program
- explain what a variable is and how it is used in programming
- use variables in a program
- incorporate variables into a program that uses a repeat command and includes decisions that enable the user to choose different paths.
Resources to include
Resources to introduce
-
coding@home TV – Primary 3 – Beginning to code in Scratch
Find out more -
Race up if mountain!
Find out more -
Introduction to variables in Scratch – Barclays Code Playground
Find out more

Years 5–6 coding@home TV – Primary 3 – Beginning to code in Scratch
Use this video to cover ‘user input and variables’, and turn a flowchart into a digital solution.
Requires
- internet access
- computers, laptops or tablets, or an interactive whiteboard to view as a class
Suggested time
24 minutesEnables students to:
- describe and explain how a variable is used in programming.
Years 5–6 Race up if mountain!
This unplugged activity is designed to teach decision-making in programming, as well as starting to teach students about variables.
Requires
- six-sided dice, glue, scissors, coloured pencils, bottle caps as game pieces
Suggested time
1 hourEnables students to:
- describe and explain how a variable is used in programming.

Years 5–6 Introduction to variables in Scratch – Barclays Code Playground
In this lesson students learn about variables using a heads or tails coin toss.
Requires
- computers. laptops or tablets
- access to Scratch 3.0 desktop version or similar visual programming language
Suggested time
1 hourEnables students to:
- describe and explain how a variable is used in programming
- create a simple program that includes a variable.

Resources to develop and consolidate learning
-
Smart communities
Find out more -
More Scratch: broadcast, decisions and variables
Find out more -
Scratch: Module 2
Find out more -
Scratch: Module 3
Find out more -
Taking a tour
Find out more -
Unit 4 activity: Score
Find out more -
Lesson 8: Guess the number
Find out more -
Getting started with Scratch: Variables
Find out more -
Creative computing curriculum
Find out more
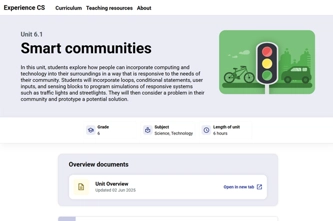


Years 5–6 Smart communities
In this unit, students will incorporate loops, conditional statements, user inputs, and sensing blocks to program simulations of responsive systems such as traffic lights and streetlights. They will then consider a problem in their community and prototype a potential solution.
Suggested time
1 hour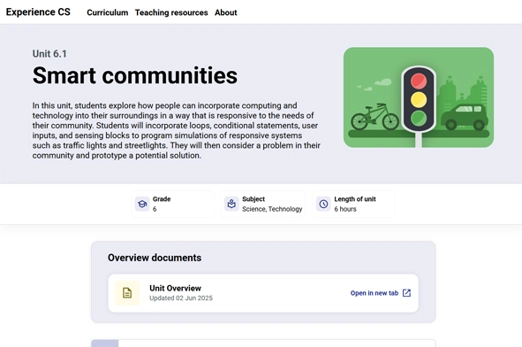
Years 5–6 More Scratch: broadcast, decisions and variables
More Scratch moves beyond the basics introduced in Introduction to Scratch. You will make apps, games and simulations using message broadcasting, if..then and if..then..else decisions and variables.
Suggested time
1 hour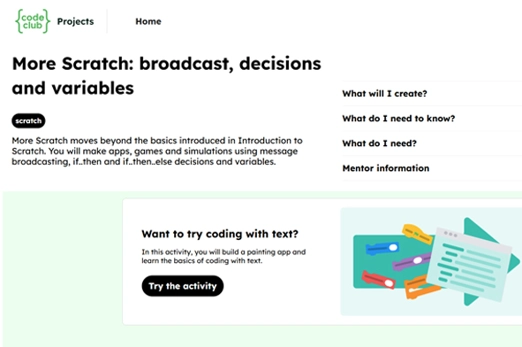
Years 5–6 Scratch: Module 2
Learn how to program your own interactive stories, games and animations that build on your programming skills.
Suggested time
1 hour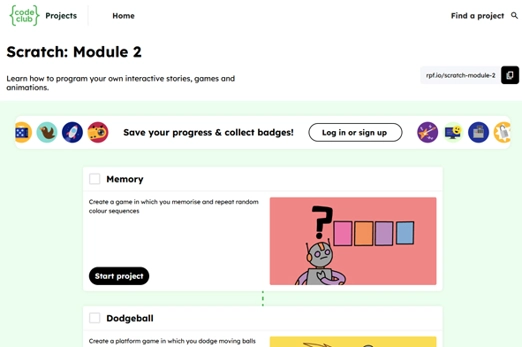
Years 5–6 Scratch: Module 3
Learn how to program your own interactive stories, games and animations. These projects are for more advanced programmers who can use custom blocks and variables.
Suggested time
1 hour
Years 5–6 Taking a tour
In this unit, students will use prior research on a geographic location to design and code an interactive quiz game in Scratch. They will plan visuals, narration, and clickable elements to share facts, then build a game using sequences, conditionals, and events — with optional scoring using variables — that teaches and tests knowledge about their chosen place.
Suggested time
1 hour
Years 5–6 Unit 4 activity: Score
Use this worksheet with sample Scratch program to introduce variables.
Requires
- computers, laptops or tablets
- access to Scratch 3.0 desktop version or similar visual programming language
Suggested time
1 hourEnables students to:
- describe and explain how a variable is used in programming
- create a simple program that includes a variable.
Years 5–6 Lesson 8: Guess the number
This tutorial demonstrates how to create a program that uses branching, iteration and variables in a visual program. (Refer to Scratch examples.)
Requires
- free course, no registration required
- internet access
- computers, laptops or tablets
Suggested time
2 hoursEnables students to:
- describe and explain how a variable is used in programming
- create a simple program that includes a variable.

Years 5–6 Getting started with Scratch: Variables
This tutorial explains how to create a variable and provides relevant examples for students to explore.
Requires
- free course, no registration required
- internet access
Suggested time
2 hoursEnables students to:
- describe and explain how a variable is used in programming
- create a simple program that includes a variable.
Years 5–6 Creative computing curriculum
Select relevant units for students to work through to develop their programming skills.
Requires
- free course, no registration required
- internet access
- computers, laptops or tablets
Suggested time
2 hoursEnables students to:
- describe and explain how a variable is used in programming
- create a simple program that includes a variable.
Resources to apply and extend learning
-
Designing a mini-game with variables
Find out more -
Getting started with Scratch: Debug
Find out more -
Check out the checkout
Find out more -
Fraudulent reviews
Find out more


Years 5–6 Designing a mini-game with variables
In this learning sequence, students are guided to design a mini-game for a target audience. They use a template to plan and record their ideas for a three-level game considering the main characters, theme and goal for each level. Students program their game using Scratch or a similar visual programming platform. Sample Scratch programs are provided for students to remix.
Requires
- internet access
- computers, laptops or tablets
- register for free use of Scratch 3.0
Suggested time
3–4 hoursEnables students to:
- design a three-level game that has a clear purpose and is designed for a particular audience
- use branching and iteration to control the flow of their program
- use a range of variables for keeping score, keeping track of lives or the use of a timer.

Years 5–6 Getting started with Scratch: Debug
This short tutorial provides useful tips on debugging as students program in Scratch.
Requires
- free course, no registration required
- internet access
- computers, laptops or tablets
Suggested time
1 hourEnables students to:
- describe and explain how an algorithm is implemented as a program
- describe ways to debug their program and explain the parts of their program.
Years 5–6 Check out the checkout
This sequence of lessons explores how to incorporate user input, decision-making, loops and variables in programming using the context of a shopping experience, particularly the checkout.
Requires
- computers, laptops or tablets
- access to Scratch 3.0 desktop version or similar visual programming language
Suggested time
3 hoursEnables students to:
- describe and explain how a variable is used in programming
- create a program that includes a variable, branching and iteration.

Years 5–6 Fraudulent reviews
In this course, students use language analysis to unravel the mysteries of suspicious reviews and begin to distinguish between genuine and fake reviews.
Requires
- computers, laptops or tablets
- free registration to Grok Learning to use Blockly
Suggested time
3 hoursEnables students to:
- describe and explain how a variable is used in programming
- create a program that includes a variable, branching and iteration.

Further reading and professional learning
-
Programming infographic: Years 3–6
Find out more -
Understanding program comprehension using the Block Model
Find out more
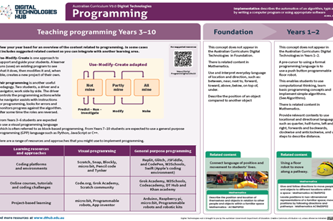

Years 5–6 Programming infographic: Years 3–6
Use this infographic as a guide to view ways programming is covered for Years 3–6.
Suggested time
30 minutes
Years 5–6 Understanding program comprehension using the Block Model
Program comprehension has been recognised as an important step in learning to program. Read this article to learn more.
Suggested time
30 minutes
Designing a digital solution
Overview
This unit explores the user-centred design process through three different pathways that incorporate visual programming. Familiarise students with the design process and use of user stories to identify user needs. Next, choose one pathway that suits your students’ needs, school context and available resources.
Achievement standards
By the end of Year 6 students develop and modify digital solutions, and define problems and evaluate solutions using user stories and design criteria.
Pathways 2 and 3 also include:
Students design algorithms involving complex branching and iteration and implement them as visual programs including variables.
Australian Curriculum
Content descriptions
Investigating and defining AC9TDI6P01
Generating and designing AC9TDI6P03, AC9TDI6P04
For pathway 2 and 3:
Evaluating AC9TDI6P06
Producing and implementing AC9TDI6P05
Generating and designing AC9TDI6P02
Related content and General Capabilities
Science: Physical sciences AC9S6U03
The Arts: Music: Creating and making; Dance: Creating and making
Critical and Creative Thinking
Cross curriculum priority: Sustainability
This topic enables students to
- follow the design process (empathise, define, ideate, prototype and test)
- generate a design to solve an identified problem based on user needs and design criteria
- test and evaluate the solution against user needs and design criteria.
For pathway 2 and 3
- design a project that uses inputs and outputs in a 3D immersive environment or on a controllable virtual or physical device
- create computer programs that involve sequencing, branching, iteration and variables.
Supplementary information
Each pathway has a slightly different focus.
The main focus of the pathway ‘Design for all using Makey Makey’ is to enable students to develop and modify digital solutions, define problems and evaluate solutions using user stories and design criteria. It draws on basic programming knowledge but is not intended to fully meet the implementation aspects of the achievement standards for this level.
The pathway ‘Design a community space in 3D’ focuses on immersive 3D environments and enables students to develop and modify digital solutions, define problems and evaluate solutions using user stories and design criteria. It includes programming and can provide evidence towards the achievement standards related to implementation for this level.
The pathway ‘Design an automated solution’ enables students to develop and modify digital solutions, define problems and evaluate solutions using user stories and design criteria. It also requires students to draw on and develop relevant programming skills and processes that relate to the ‘Producing and implementing’ aspects of the achievement standards for this level.
Watch this video for a quick overview of the unit and how to use its resources with your students.
Assessment View assessment advice
Achievement standards
Digital Technologies: Years 5-6
By the end of Year 6 students develop and modify digital solutions, and define problems and evaluate solutions using user stories and design criteria.
Pathways 2 and 3 also include:
Students design algorithms involving complex branching and iteration and implement them as visual programs including variables.
Rubrics
Select the relevant rubric depending on the selected pathway for this topic.
Designing a solution incorporating Makey Makey
This rubric provides benchmarks for assessing different levels of:
- knowledge of Makey Makey board components connected as a circuit and identifies conductible/non-conductible materials (Science)
- defining problems, developing user stories and identifying design criteria
- evaluating solutions using user stories and design criteria.
Design a community space in 3D
This rubric provides benchmarks for assessing different levels of complexity and proficiency in:
- defining problems and evaluating solutions
- using control structures, variables and user input in programming tasks. It emphasises the progression from basic sequences to more advanced programs with complex branching, iteration and the use of variables.
Design an automated solution
This rubric provides benchmarks for assessing different levels of complexity and proficiency in:
- defining problems and evaluating solutions
- using control structures, variables and user input in programming tasks. It emphasises the progression from basic sequences to more advanced programs with complex branching, iteration and the use of variables.
Rubric: Designing a solution incorporating Makey Makey
| Knowledge of Makey Makey board and interface Science (Explains a circuit and conductible/ non-conductible materials.) | identifies and describes the following parts: Scratch program or online interface, Makey Makey board, USB cord, Alligator clips, conductible/non-conductible materials | assembles the parts in the correct manner to achieve a working circuit using at least one conductive material | assembles the parts in the correct manner to achieve a working circuit and links desired on-screen events that are triggered on receiving the keystroke | assembles the parts in the correct manner to achieve a working circuit, identifying conductible/non-conductible materials. Explains how the circuit works and demonstrates the key strokes to control the desired event |
| Generate designs incorporating a Makey Makey board and interface/Scratch program Define problems and develop user stories and identify design criteria. | has not defined the problem or identified user needs in their design | defines the problem, identifies the user needs and how their design meets those needs | defines the problem, identifies user needs, develops a user story showing the goal to be accomplished and the reason for the goal | clearly defines the problem and identifies user needs, develops a user story showing the goal to be accomplished and the reason for the goal. The design clearly shows how the user experience is improved and meets the user needs and design criteria |
| Create and evaluate digital solution Evaluate solutions using user stories and design criteria. | uses an existing program and connects a Makey Makey board to create a working solution | uses an existing program and connects a Makey Makey board to create a working solution based on user needs | follows their design, which incorporates the user story, tests their solution to ensure it meets the user needs and makes changes as required. Uses an existing program such as a Scratch program | follows their design, which incorporates the user story, tests their solution to ensure it meets the user needs and makes changes as required. Explains how the solution meets the user need and justifies the design choices. Modifies or creates their own interface such as a Scratch program |
Rubric: Design a community space in 3D
| Design and create a community space in Minecraft | describes some basic elements of a community space | describes elements of a community space and their purpose and organisation within the Minecraft environment | describes and creates a thoughtful community space design that is functional and visually appealing, considers the needs and preferences of potential users | describes and creates a thoughtful community space design that is functional and visually appealing, considers the needs and preferences of potential users. Explains reasons such as usability and aesthetics |
| Produce and implement visual programs (in Minecraft) | with guidance, creates a program with basic sequential commands, such as moving or placing blocks in a logical order | creates a program with sequential commands, uses conditional statements to control the flow of the program and adapts to various in-game situations or employs loops to repeat actions | creates a program with user input in a sequence of logical steps that includes multiple decisions (complex branching) and iteration (repeat steps) | creates a program with user input in a sequence of logical steps that includes multiple decisions (complex branching) and iteration (repeat steps). Includes variables to store and manipulate data, enhancing the program's functionality |
Rubric: Design an automated solution
| Design and create a digital solution using micro:bit | with guidance, proposes a solution to a problem, but lacks clarity or practicality | designs a solution that addresses the problem, showing some consideration for user needs | designs a thoughtful and practical solution that effectively addresses the problem and considers user needs | designs a thoughtful and practical solution that effectively addresses the problem and considers user needs. Explains design criteria for key functions in terms of the user |
| Produce and implement visual programs (micro:bit) | with guidance, creates a program with basic sequential commands | creates a program with sequential commands and uses conditional statements to control the flow of the program or employs loops to repeat actions | creates a program with user input in a sequence of logical steps that includes multiple decisions (complex branching) and iteration (repeat steps) | creates a program with user input in a sequence of logical steps that includes multiple decisions (complex branching) and iteration (repeat steps). Includes variables to store and manipulate data, enhancing the program's functionality |
Unit sequence
This topic offers 3 pathways
Core Unit
User-focused design process
Students are introduced to the design process (empathise, define, ideate, prototype and test).Design for all using Makey Makey
Students design a digital solution that solves a problem for a user with an identified need. They incorporate the Makey Makey board into their design.Design a community space in 3D
Using the context of designing a community space students create and test their digital solution against the user stories and design criteria.Design an automated solution
Students design an automated solution enables students to apply their programming knowledge and skills to solve a problem or challenge.User-focused design process
What is this about?
Students are introduced to the design process (empathise, define, ideate, prototype and test). This process begins with empathising with the users and identifying their needs. It involves creating user stories to inform design considerations. In the define phase, the problem or challenge is defined, identifying goals and any constraints that need to be address in the design. In the ideate phase, various solutions are generated through brainstorming. Next a prototype is developed which can be paper-based or simple digital mock ups. The test phase involves getting feedback from the user to gain insights on usability and effectiveness in meeting the design criteria.
Once students have developed familiarity and confidence with the design process and the use of user stories, they can be presented with a specific problem or challenge that requires designing a digital solution. These are presented as options in the three pathways for this unit.
Content descriptions
Define problems with given or co-developed design criteria and by creating user stories AC9TDI6P01
Design a user interface for a digital system AC9TDI6P03
Generate, modify, communicate and evaluate designs AC9TDI6P04
Evaluate existing and student solutions against the design criteria and user stories and their broader community impact AC9TDI6P06
This sequence enables students to:
- define the problem and identify user needs
- develop a user story showing the goal to be accomplished and the reason for the goal
- generate a design to solve an identified problem based on user needs and design criteria
- test and evaluate the solution against user needs and design criteria.
Supplementary information
The emphasis on empathising with users and understanding their needs is an important phase in designing solutions that really address users’ requirements. Creating user stories is an effective way to capture and communicate user needs, and it helps designers keep the users' perspectives at the forefront throughout the design process.
Resources to include
Resources to introduce
-
Human-centered design sits at the intersection of empathy and creativity
Find out more -
coding@home TV – Finding a target audience
Find out more -
Design thinking process – Empathising
Find out more -
Redesign the school lunch experience
Find out more
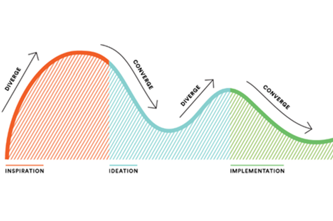
Years 5–6 Human-centered design sits at the intersection of empathy and creativity
View the video (duration 1:55 min) to introduce design process.
Requires
- internet access
- computer and interactive whiteboard to view as a class
Suggested time
2 minutesEnables students to:
- describe steps of design to suit user needs and importance of empathising
- explain the importance of identifying the needs of a user.
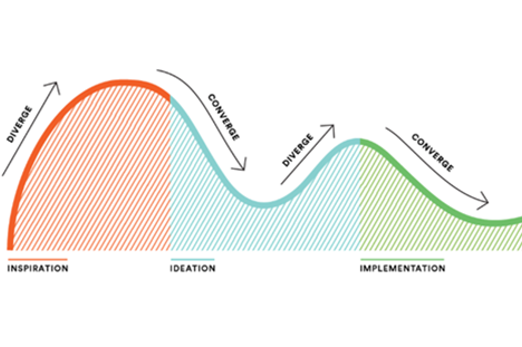
Years 5–6 coding@home TV – Finding a target audience
View the video (duration 23:36 min) to introduce understanding the user needs in the design process, using the example of a chat bot.
Requires
- internet access
- computer and interactive whiteboard to view as a class
Suggested time
24 minutesEnables students to:
- describe steps of design to suit user needs and importance of empathising
- explain the importance of identifying the needs of a user.
Years 5–6 Design thinking process – Empathising
In this lesson students explore the design thinking process of empathising to understand more about the users and the problem they are trying to solve.
Requires
- sticky notes
Suggested time
1 hourEnables students to:
- describe steps of design to suit user needs and importance of empathising
- identify the needs of a user.

Years 5–6 Redesign the school lunch experience
Use this unplugged activity to help your students focus on user needs and follow the design process. (You could substitute a different focus instead of school lunches).
Requires
- printed worksheets (provided by resource)
Suggested time
2 hoursEnables students to:
- identify the needs of a user
- define the problem
- generate possible solutions
- create a prototype and gain feedback on design.
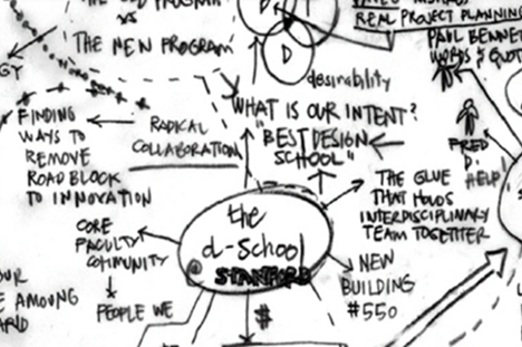
Resources to develop and consolidate learning
-
User stories and design criteria: Fair use of the school basketball court
Find out more -
User story
Find out more -
DT applied: Design thinking
Find out more -
DT applied: Design Thinking: Student resources
Find out more


Years 5–6 User stories and design criteria: Fair use of the school basketball court
Use this slidedeck to support and guide students to develop a user story and design criteria as part of the ideation phase of design process.
Requires
- slides (PowerPoint)
Suggested time
1 hourEnables students to:
- identify needs of a user
- create a user story
- explain how a user story is used in the design process
- develop design criteria based on a user's needs and goals.

Years 5–6 User story
Use this slidedeck to support and guide students to develop a user story as part of the ideation phase of design process.
Requires
- slides (PowerPoint)
Suggested time
1 hourEnables students to:
- identify needs of a user
- create a user story
- explain how a user story is used in the design process.

Years 5–6 DT applied: Design thinking
This module introduces students to Design Thinking, a set of techniques and processes for solving problems.
Requires
- register for free use of this tutorial and assign students to this task
- internet access
- computers, laptops or tablets
Suggested time
5 hoursEnables students to:
- identify needs of a user
- define the problem
- generate possible solutions
- create a prototype and gain feedback on design.
Years 5–6 DT applied: Design Thinking: Student resources
A comprehensive resource with printable handouts for students to engage in the design process.
Requires
- internet access
- computers, laptops or tablets
- Makey Makey board
- conductive materials
Suggested time
3 hoursEnables students to:
- identify needs of a user
- define the problem
- generate possible solutions
- create a prototype and gain feedback on design.
Further reading and professional learning
-
Creative Technologies Education
Find out more -
knowledgehut: Agile user story example and templates
Find out more
Years 5–6 Creative Technologies Education
Students as designers of digital games.
Suggested time
1 hour
Years 5–6 knowledgehut: Agile user story example and templates
An article that provides insights into user stories and how to write them.
Suggested time
30 minutes
Design for all using Makey Makey
What is this about?
Students design a digital solution that solves a problem for a user with an identified need. As students design a digital solution, they can apply their understanding of how data is input and output by digital systems. Students empathise with the target audience, going through a process of ideation and then design. Creating enables students to test whether their design works as expected. Makey Makey is a simple circuit board that enables students to turn any conductible surface into an input device for their computer. Students can incorporate the Makey Makey board into their design.
Content descriptions
Define problems with given or co-developed design criteria and by creating user stories AC9TDI6P01
Design a user interface for a digital system AC9TDI6P03
Generate, modify, communicate and evaluate designs AC9TDI6P04
Evaluate existing and student solutions against the design criteria and user stories and their broader community impact AC9TDI6P06
This sequence enables students to:
- define the problem and identify user needs
- develop a user story, showing the goal to be accomplished and the reason for the goal
- generate a design to solve an identified problem based on user needs and design criteria
- test and evaluate the solution against user needs and design criteria.
Supplementary information
Input devices allow us to enter raw data into a computer. A digital system, such as a tablet or desktop computer, processes the data. It then produces outputs that are communicated using an output device. Input devices can be manual or automatic. Data such as text, images, sound and numbers are input into a digital system using a range of digital devices. The output is communicated using different components; for example, a speaker for sound. To enable data input, specific software may be required; for example, to gain audio and video input from a webcam, the digital system requires suitable software. This software is also used to output the webcam data to a screen. Users of digital systems need to have the ability to enter data into computers. Various peripheral devices have been created to fulfil this need and this process of invention continues.
The Makey Makey board will plug directly into the computer’s USB peripheral port and essentially behave like an input device. When specific keys are pressed the Makey Makey board can mimic those keystrokes. Students can explore and use different materials to test ways to provide an input that has a functional benefit for their user. For example, users with limited fine-motor control may benefit from a design that has larger, easier controls to use keyboard strokes – such as up, down, left and right arrows – to interact with a game. Makey Makey is an invention kit available for purchase that allows you to interact with a computer, using everyday objects as a replacement for inputs such as a keyboard or computer mouse. Activating a key means creating a closed circuit. For the circuit to work, electrons have to be able to flow from the Makey Makey input key to Makey Makey’s ground pin. So materials chosen as the input must conduct some level of electrical energy. This includes aluminium foil, a banana and even a circuit drawn in grey lead pencil.
Resources to include
Resources to introduce
-
What are inputs and outputs?
Find out more -
Ultimate stomping pad
Find out more -
Makey Makey orchestra
Find out more

Years 5–6 What are inputs and outputs?
Revise inputs and outputs, and introduce and demonstrate Makey Makey as another form of input that can replace keyboard strokes.
Requires
- internet access
- computers, laptops or tablets
- Makey Makey board
- conductive materials
Suggested time
30 minutesEnables students to:
- describe digital systems as having inputs and outputs
- describe the events of a computer program or application that are triggered by a keyboard stroke
- describe the ways to use the Makey Makey board to replace the keyboard strokes to trigger an event.

Years 5–6 Ultimate stomping pad
Use this lesson to design a dance incorporating a stomping mat.
Requires
- internet access
- computers, laptops or tablets
- Makey Makey board
- conductive materials
Suggested time
2 hoursEnables students to:
- describe digital systems as having inputs and outputs
- describe the events of a computer program or application are triggered by a keyboard stroke
- use a Makey Makey board to replace the keyboard strokes to trigger an event
- describe the sequence of their algorithm including any loops (iterations).
Years 5–6 Makey Makey orchestra
In this learning sequence students explore an orchestra and use Makey Makey to make a musical instrument for an ensemble.
Requires
- internet access
- computers, laptops or tablets
- Makey Makey board
- conductive materials
Suggested time
1 hourEnables students to:
- describe digital systems as having inputs and outputs
- describe the events of a computer program or application are triggered by a keyboard stroke
- use a Makey Makey board to replace the keyboard strokes to trigger an event
- describe the sequence of their algorithm including any loops (iterations).
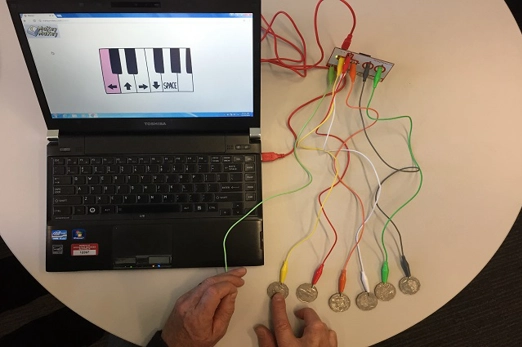
Resources to develop and consolidate learning
-
Design thinking, game controllers, and adaptive technology – Michael Bycraft
Find out more -
Prototype game controller soccer app
Find out more -
New Makey Makey plug and play interactive poster app
Find out more -
Makey Makey projects for Year 3 to 6 students
Find out more

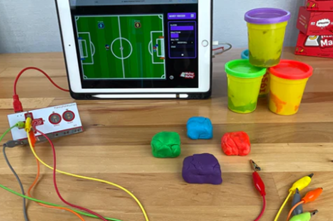
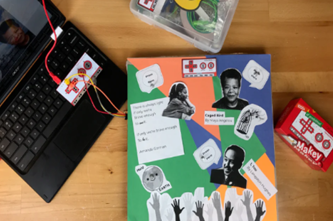
Years 5–6 Design thinking, game controllers, and adaptive technology – Michael Bycraft
Explore designs using Makey Makey to create assistive technology for others.
Requires
- internet access
- computers, laptops or tablets
- Makey Makey board
- conductive materials
Suggested time
3 hoursEnables students to:
- describe digital systems as having inputs and outputs
- describe the events of a computer program or application that are triggered by a keyboard stroke
- use a Makey Makey board to replace the keyboard strokes to trigger an event
- describe the sequence of their algorithm including any loops (iterations).
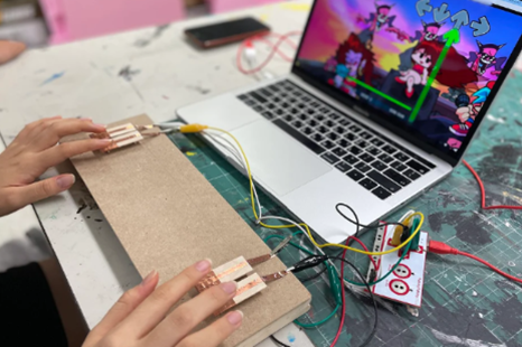
Years 5–6 Prototype game controller soccer app
Explore designs using Makey Makey to create game controllers for others.
Requires
- internet access
- computers, laptops or tablets
- Makey Makey board
- conductive materials
Suggested time
3 hoursEnables students to:
- describe digital systems as having inputs and outputs
- describe the events of a computer program or application that are triggered by a keyboard stroke
- use a Makey Makey board to replace the keyboard strokes to trigger an event
- describe the sequence of their algorithm including any loops (iterations).
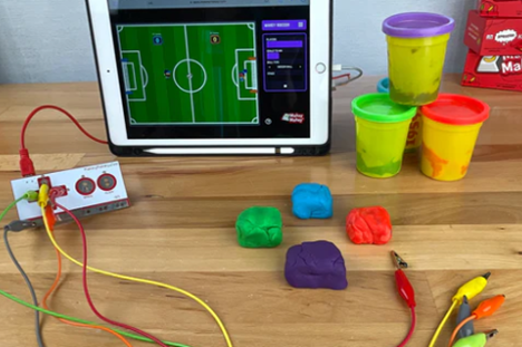
Years 5–6 New Makey Makey plug and play interactive poster app
This lesson introduces students to designing an interactive poster combining Scratch and Makey Makey.
Requires
- internet access
- computers, laptops or tablets
- Makey Makey board
- conductive materials
- scratch V3 programming environment
Suggested time
3 hoursEnables students to:
- describe digital systems as having inputs and outputs
- describe the events of a computer program or application that are triggered by a keyboard stroke
- use a Makey Makey board to replace the keyboard strokes to trigger an event
- describe the sequence of their algorithm including any loops (iterations).
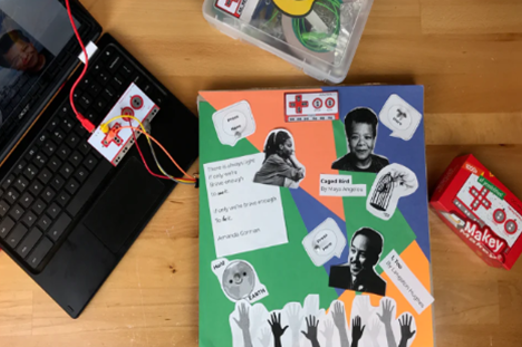
Years 5–6 Makey Makey projects for Year 3 to 6 students
These lesson ideas demonstrate how to combine Makey Makey and Scratch to create all sorts of interesting solutions with students, as well as teach the basics of circuitry, conductive materials and algorithms.
Requires
- internet access
- computers, laptops or tablets
- Makey Makey board
- conductive materials
- scratch V3 programming environment
Suggested time
3 hoursEnables students to:
- describe digital systems as having inputs and outputs
- describe the events of a computer program or application that are triggered by a keyboard stroke
- use a Makey Makey board to replace the keyboard strokes to trigger an event
- describe the sequence of their algorithm including any loops (iterations).
Resources to extend and integrate learning
-
Makey Makey braille calculator by Tracy Zhang
Find out more -
Investigating conductivity with Makey Makey boards
Find out more
Years 5–6 Makey Makey braille calculator by Tracy Zhang
Use this lesson as inspiration to create a calculator for a person with no or low vision.
Requires
- internet access
- computers, laptops or tablets
- Makey Makey board
- conductive materials
- scratch V3 programming environment
Suggested time
5 hoursEnables students to:
- describe digital systems as having inputs and outputs
- describe the events of a computer program or application are triggered by a keyboard stroke
- use a Makey Makey board to replace the keyboard strokes to trigger an event
- describe the sequence of their algorithm including any loops (iterations), branching and variables.

Years 5–6 Investigating conductivity with Makey Makey boards
In this sequence of lessons students explore how electrical energy can be transferred and transformed in electrical circuits, using Makey Makey boards as the basis for experimentation and recoding of data.
Requires
- internet access
- computers, laptops or tablets
- Makey Makey board
- conductive materials
Suggested time
1 hourEnables students to:
- describe digital systems as having inputs and outputs
- classify materials as conductive or non-conductive
- describe the events of a computer program or application are triggered by a keyboard stroke
- use a Makey Makey board to replace the keyboard strokes to trigger an event.
Professional learning
-
Case study – Spotlighted unit – Game controller design
Find out more -
Scratch and Makey Makey (June 2017)
Find out more
Years 5–6 Case study – Spotlighted unit – Game controller design
View this case study for a way to incorporate Makey Makey into design thinking for a person with colour blindness.
Suggested time
30 minutes
Years 5–6 Scratch and Makey Makey (June 2017)
This webinar presented by Jo Klein, focuses on design thinking by integrating Makey Makey and Scratch.
Suggested time
30 minutes
Design a community space in 3D
What is it about?
Designing, building and exploring virtual worlds that resemble the real world allows students to apply coding skills in a practical context. They can build structures, automate tasks and create contraptions drawing on, and developing, programming skills. Minecraft enables students to engage in an immersive virtual 3D environment and allows them to see the immediate results of their code. They can quickly iterate, test different approaches, and observe how changes affect their virtual world. This feedback loop promotes a hands-on learning experience and helps students grasp coding concepts. Using the context of designing a community space (which can incorporate green city or green building design), students define the problem, identifying user needs. They create user stories based on user needs. They create and test their digital solution against the user stories and design criteria.
Content descriptions
Define problems with given or co-developed design criteria and by creating user stories AC9TDI6P01
Design a user interface for a digital system AC9TDI6P03
Generate, modify, communicate and evaluate designs AC9TDI6P04
Evaluate existing and student solutions against the design criteria and user stories and their broader community impact AC9TDI6P06
Design algorithms involving multiple alternatives (branching) and iteration AC9TDI6P02
Implement algorithms as visual programs involving control structures, variables and input AC9TDI6P05
This sequence enables students to:
- define the problem and identify user needs
- develop a user story showing the goal to be accomplished and the reason for the goal
- generate a design to solve an identified problem based on user needs and design criteria
- design algorithms involving multiple alternatives (branching) and iteration
- create computer programs that involve sequencing, branching, iteration and variables
- test and evaluate the solution against user needs and design criteria.
Resources to include
Resources to introduce
-
Turning learning into action: Starting a community action plan
Find out more -
Schools reinventing cities – Official Minecraft trailer
Find out more -
Minecraft hour of code
Find out more -
Minecraft hour of code designer
Find out more
Years 5–6 Turning learning into action: Starting a community action plan
Use these suggested steps to identify needs in your community and plan an approach to address the issues.
Requires
- community walk
Suggested time
1 hourEnables students to:
- identify community issues.

Years 5–6 Schools reinventing cities – Official Minecraft trailer
Inspire students to design a community in Minecraft.
Requires
- internet access
- computers, laptops or tablets
- access to Minecraft free edition
Suggested time
1 minuteEnables students to:
- identify community issues
- describe how these issues could be solved using a virtual world example.
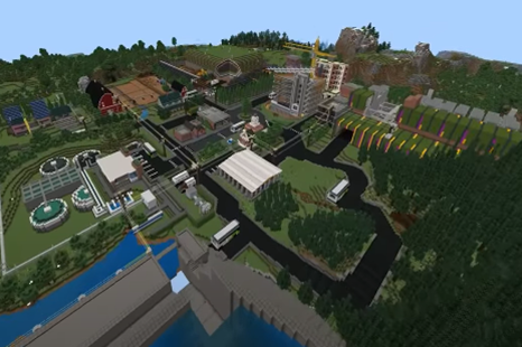
Years 5–6 Minecraft hour of code
Use blocks of code to take a character on an adventure through a Minecraft world.
Requires
- internet access
- computers, laptops or tablets
- access to Minecraft free edition
Suggested time
1 hourEnables students to:
- learn basic coding such as using loops to repeat steps (iteration), using inputs and including if/then statements (branching).

Years 5–6 Minecraft hour of code designer
Program animals and other Minecraft creatures in your own version of Minecraft.
Requires
- internet access
- computers, laptops or tablets
- access to codestudio.org
Suggested time
1 hourEnables students to:
- learn basic coding such as using loops to repeat steps (iteration), using inputs and including if/then statements (branching).
Resources to develop and consolidate learning
-
Design a space for your community
Find out more -
Green building
Find out more -
Coding with Minecraft | Minecraft Education
Find out more
Years 5–6 Design a space for your community
Use this student e-magazine that has tutorials and follows the design process to solve a community issue using Minecraft.
Requires
- internet access
- computers, laptops or tablets
- access to Minecraft free edition
Suggested time
1 hourEnables students to:
- identify community issues
- learn basic coding such as using loops to repeat steps (iteration), using inputs and including if/then statements (branching).

Years 5–6 Green building
Investigate innovations in buildings that help to save energy and protect the environment. In a group, build a new home that uses some of these techniques.
Requires
- internet access
- computers, laptops or tablets
- access to Minecraft free edition
Suggested time
1 hourEnables students to:
- identify community issues
- learn basic coding such as using loops to repeat steps (iteration), using inputs and including if/then statements (branching).
Years 5–6 Coding with Minecraft | Minecraft Education
For students who need to learn coding sequences, iteration and variables.
Requires
- internet access
- computers, laptops or tablets
- access to Minecraft free edition
Suggested time
10 hoursEnables students to:
- learn basic coding such as using loops to repeat steps (iteration), using inputs and including if/then statements (branching)
- learn and apply the coding concept of variables.

Resources to apply and extend learning


Years 5–6 Greening our city
Use this lesson to explore the design process to solve a community issue using Minecraft.
Requires
- internet access
- computers, laptops or tablets
- access to Minecraft free edition
Suggested time
2 hoursEnables students to:
- use conditional formatting to automate filling cells based on a value.
Years 5–6 Building community
Create a community space in Minecraft by building important structures and services.
Requires
- internet access
- computers, laptops or tablets
- access to Minecraft free edition
Suggested time
2 hoursEnables students to:
- use programming skills to modify pixel based images.
Further reading and professional learning
-
How to build an integrated STEM lesson using Minecraft
Find out more -
Case study – Spotlighted unit – Enhancing communities with Minecraft
Find out more
Years 5–6 How to build an integrated STEM lesson using Minecraft
Plan a sustainable house.
Suggested time
30 minutes
Years 5–6 Case study – Spotlighted unit – Enhancing communities with Minecraft
Read this case study to learn more about implementing a Minecraft project.
Suggested time
30 minutes
Design an automated solution
What is it about?
Designing an automated solution enables students to apply their programming knowledge and skills to solve a problem or challenge. When designing a solution, students consider the design criteria and needs of the user to ensure it meets the requirements. They design an algorithm as a series of steps with decisions and iteration. They select a technology type or application best suited to implement the algorithm which they are familiar with and to which they have access.
Students may choose:
- to create a computer program such as Scratch to automate tasks involving interconnected devices, for example, a virtual assistant to control smart devices, such as in-home automation
- to program a robot to perform automated tasks; this may involve writing code to plan a pathway and navigate its environment, or more complex programming to control motors, sensors and other components of the robot
- to use a micro-controller such as a micro:bit, the solution may incorporate sensors to sense their environment to automate a task.
Content descriptions
Define problems with given or co-developed design criteria and by creating user stories AC9TDI6P01
Design a user interface for a digital system AC9TDI6P03
Generate, modify, communicate and evaluate designs AC9TDI6P04
Evaluate existing and student solutions against the design criteria and user stories and their broader community impact AC9TDI6P06
Design algorithms involving multiple alternatives (branching) and iteration AC9TDI6P02
Implement algorithms as visual programs involving control structures, variables and input AC9TDI6P05
This sequence enables students to:
- design a project that uses inputs and outputs on a controllable physical or virtual device
- follow the design process (empathise, define, ideate, prototype and test)
- use if/then statements to compare a variable to a value
- create computer programs that use inputs and outputs on a controllable device.
Supplementary information
The technology type chosen for this unit will depend on resources available and students’ familiarity with the technology. Suggested lessons often focus on a particular technology type. It may be possible to apply the approach to a similar application focusing on the key concepts being presented and substitute a technology to which students have access.
A sensor is a device that senses and reacts to some type of input from the physical environment. Types of input include heat, light, moisture, motion, pressure or any other environmental phenomenon. The result is typically a signal that is either translated to a human-readable display at the sensor location or sent electronically over a network for reading or further processing.
Resources to include
Resources to introduce
-
Making ‘sense’ of robot sensors
Find out more -
Cross age making a robot
Find out more -
Artificial Intelligence explainers: Video 2: AI in our everyday life
Find out more -
Home automation with AI
Find out more


Years 5–6 Making ‘sense’ of robot sensors
Use this unplugged lesson to introduce sensors using the example of bats and echolocation.
Requires
- printed sheets or cards (documents provided)
Suggested time
1 hourEnables students to:
- describe how living things perceive their environment using senses
- relate sensory technology to robotic applications identifying the type of input data.

Years 5–6 Cross age making a robot
In this unplugged project, students collaborate on a code for an unplugged robot. They design, test and modify the robot and create instruction manuals.
Requires
- recycled materials to build a model robot
Suggested time
3 hoursEnables students to:
- explain how the robot interacts with its environment
- design an algorithm to describe the sequence and decisions.

Years 5–6 Artificial Intelligence explainers: Video 2: AI in our everyday life
Use this video to learn how a machine performs human-like behaviours such as recognising speech, text and images.
Requires
- internet access
- computer and interactive whiteboard to view as a class
Suggested time
5 minutesEnables students to:
- describe the role of Artificial Intelligence (AI) in automating tasks
- describe the input-process-output of intelligent machines.

Years 5–6 Home automation with AI
Use this lesson to explore the AI that could control a home automation system.
Requires
- free access to MyComputerbrain website
Suggested time
30 minutesEnables students to:
- describe how a virtual assistant interacts with its environment transmitting data
- describe a home automation system using input-process-output.
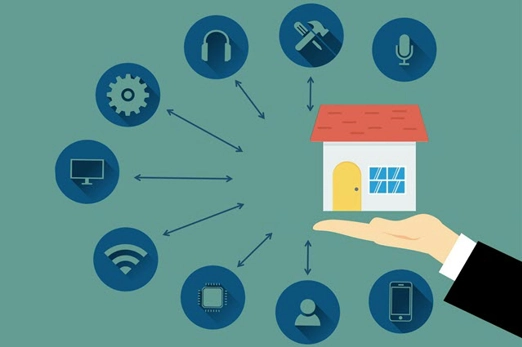
Resources to develop and consolidate learning
-
Introduction to micro:bit: sensors, buttons and lights!
Find out more -
Step counter
Find out more -
Sphero: Catch me if you can
Find out more -
micro:bit crash course
Find out more


Years 5–6 Introduction to micro:bit: sensors, buttons and lights!
In this introduction to coding for the micro:bit, you will learn how to sense and respond to the world around you while looking after yourself.
Suggested time
1 hour
Years 5–6 Step counter
This tutorial guides students to code a micro:bit into a step counter to help track steps walked.
Requires
- physical micro:bit
- internet access
- computers, laptops or tablets
Suggested time
2 hoursEnables students to:
- use an if/then statement to compare a variable to a value
- create computer programs that use inputs and outputs on a controllable device.
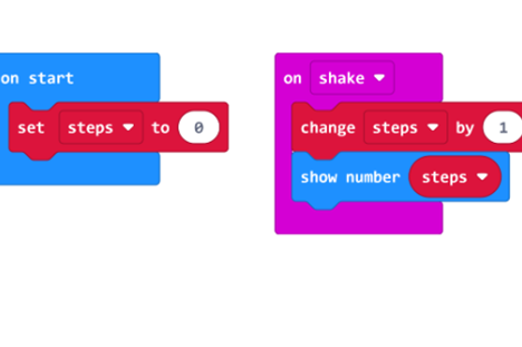
Years 5–6 Sphero: Catch me if you can
Students write a set of instructions to help a Sphero navigate its environment.
Requires
- sphero robot
- wi-fi access
- tablet and app
Suggested time
2 hoursEnables students to:
- use an if/then statement to compare a variable to a value
- create computer programs that use inputs and outputs on a controllable device.
Years 5–6 micro:bit crash course
Use the micro:bit simulator to explore what the micro:bit can do and create simple programs.
Requires
- register for free use of this tutorial and assign students to this task
- internet access
- computers, laptops or tablets
Suggested time
3 hoursEnables students to:
- use an if/then statement to compare a variable to a value
- create computer programs that use inputs and outputs on a controllable device.
Resources to apply and extend learning
-
Home automation programming
Find out more -
Fun projects with language translation
Find out more -
Automated soil moisture sensor
Find out more -
digIT Robotics workbook
Find out more -
EV3 lessons
Find out more

Years 5–6 Home automation programming
Incorporate binary into programming, switching appliances on and off.
Requires
- computers. laptops or tablets
- scratch 3.0 desktop version
Suggested time
2 hoursEnables students to:
- create a program that turns switches on and off
- include user input, branching, iteration and variables.
Years 5–6 Fun projects with language translation
Explore automation using the context of chat bots and language translation.
Requires
- computers, laptops or tablets
- scratch 3.0 desktop version
Suggested time
2 hoursEnables students to:
- create a program that responds to user input that includes branching, iteration and variables.

Years 5–6 Automated soil moisture sensor
The soil moisture sensor project integrates science understanding and computational thinking to solve a problem about sustainable watering practices.
Requires
- physical micro:bit
- internet access
- computers, laptops or tablets
Suggested time
2 hoursEnables students to:
- collect data using a sensor
- program coding software to automate a task.
Years 5–6 digIT Robotics workbook
This lesson provides an introduction to coding MakerBots (mBots) using a block language. It provides introductory information about the robot's sensors, motors and microcontroller so students can control the mBot.
Requires
- a robotic device such as mBot
Suggested time
2 hoursEnables students to:
- use an if/them statement to compare a variable to a value
- create computer programs that use inputs and outputs on a controllable device.
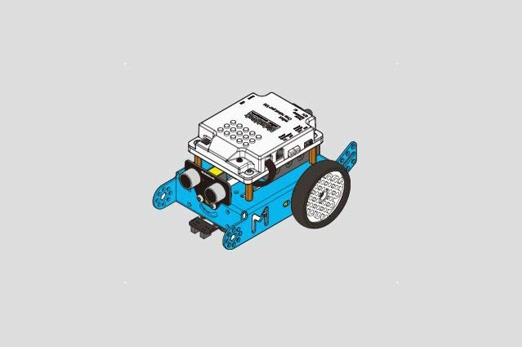
Years 5–6 EV3 lessons
Lesson plans and projects for Lego Mindstorms EV3 Focus on lessons with sensors.
Requires
- a robotic device such as Mindstorms EV3
Suggested time
2 hoursEnables students to:
- use an if/then statement to compare a variable to a value
- create computer programs that use inputs and outputs on a controllable device.

Further reading and professional learning
-
Features of the micro:bit!
Find out more -
micro:bit projects
Find out more -
Design Thinking 101
Find out more
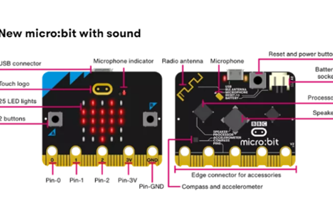


Years 5–6 Features of the micro:bit!
Explore this user guide for coding possibilities when using the micro:bit.
Suggested time
30 minutes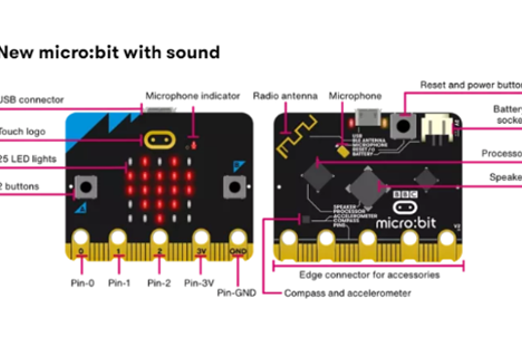
Years 5–6 micro:bit projects
A range of activities that can be completed with the micro:bit, including game-making and toys.
Suggested time
30 minutes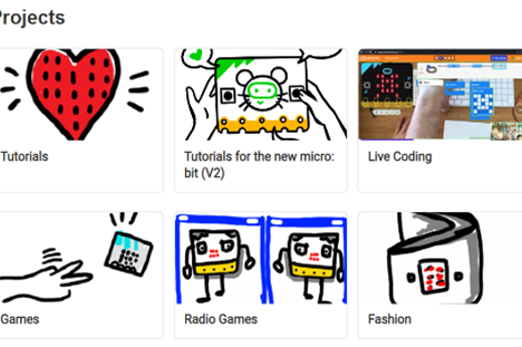
Years 5–6 Design Thinking 101
Use this video as a guide to the design thinking process.
Suggested time
3 minutes
Collaborative project
Overview
When collaborating safely online students need to treat others with respect, being aware of the impact of their online actions. They learn how effective communication contributes to a positive team environment. Collaborating on a digital project helps students develop essential project management skills such as setting goals, dividing tasks and meeting deadlines. Students use critical thinking to evaluate information online as they conduct research on their digital project, which also gives them opportunity to practise agreed online behaviours and protocols.
Achievement standards
Students select and use appropriate digital tools effectively to plan, create, locate and share content, and to collaborate, applying agreed conventions and behaviours. They identify their digital footprint and recognise its permanence.
Australian Curriculum
Content descriptions
Collaborating and managing AC9TDI6P07, AC9TDI6P08
Privacy and security AC9TDI6P10
Related content and General Capabilities
Humanities and Social Sciences AC9HS5S02, AC9HS6S02
Health and Physical Education AC9HP6P08
This topic enables students to
- describe appropriate behaviours and potential dangers while online
- co-create classroom protocols to follow to be responsible and stay safe online
- describe how to use suitable digital platforms and tools for sharing and collaboration
- identify online activities that contribute to their digital footprint
- efficiently plan tasks and collaborate online following agreed behaviours and protocols.
Watch this video for a quick overview of the unit and how to use its resources with your students.
Assessment View assessment advice
Achievement standards
Digital Technologies: Years 5-6
By the end of Year 6, students select and use appropriate digital tools effectively to plan, create, locate and share content, and to collaborate, applying agreed conventions and behaviours. They identify their digital footprint and recognise its permanence.
Assessment task
Use this Assessment task design by Qld teacher Samantha Ephraims, that guides students to discuss, research and develop an online safety narrative, suitable for use as an infographic. They select and use appropriate digital tools to plan, create, locate and share content, considering the permanency of their digital footprint. The assessment task includes a rubric and marking guide.
Rubrics
Use this rubric to assess students’ proficiency in:
- digital tool selection
- knowledge of agreed conventions and behaviours
- collaborating and applying agreed conventions and behaviours
- identifying their digital footprint and recognising its permanence.
Digital tool selection, digital citizenship, and content creation and collaboration
| Digital tool selection | with guidance, selects and uses digital tools for collaboration | selects and uses digital tools for collaboration, with occasional need for assistance | identifies and chooses suitable digital tools for tasks, considering the needs of the project and peers | independently selects suitable digital tools and effectively uses them, demonstrating a high level of competency |
| Knowledge of agreed conventions and behaviours | with guidance, identifies appropriate and potentially unsafe online behaviours | identifies appropriate and potentially unsafe online behaviours and describes a set of rules or instructions that will minimise the risk posed by unsafe online behaviours | contributes to, and describes, a co-created set of rules to stay safe online and minimise the risk posed by unsafe behaviours | actively contributes to, and describes, a co-created set of rules to stay safe online; describes ways to be safe online and identifies and gives reasons why this is important |
| Collaborating and applying agreed conventions and behaviours | with guidance, uses digital tools for content creation and collaboration | uses digital tools for content creation and collaboration, with occasional need for support, showing an awareness of behaviours and protocols | uses digital tools for content creation and collaborates online, following agreed behaviours and protocols | uses digital tools, demonstrating high-level content creation skills; consistently displays and promotes safe and respectful behaviours and protocols; evaluates the appropriateness of their behaviour and conduct online |
| Identifying their digital footprint and recognising its permanence | with guidance, describes a digital footprint | describes what online activities contribute to a digital footprint | describes what online activities contribute to a digital footprint and identifies their digital footprint | describes what online activities contribute to a digital footprint, identifies their digital footprint and explains its permanence |
Unit sequence
This topic offers 2 sequential units
Unit 1
Establish protocols
Students discuss agreed behaviours and protocols for collaborating safely online and being aware of their digital footprint.Unit 2
Collaboration and project
Students use digital tools for collaborative work and task planning, and demonstrate agreed behaviours and protocols.Establish protocols
What is this about?
As students develop their communication skills they learn the importance of conveying ideas respectfully and responsibly, ensuring a positive online environment for working on collaborative tasks. It is important when working online that students are aware of the digital trail they leave behind. The approach outlined in this unit encourages students to work effectively in a digital environment, be responsible digital citizens, and recognise the extent of their digital footprint.
Content descriptions
Select and use appropriate digital tools effectively to share content online, plan tasks and collaborate on projects, demonstrating agreed behaviours AC9TDI6P08
Explain the creation and permanence of their digital footprint and consider privacy when collecting user data AC9TDI6P10
This sequence enables students to:
- describe appropriate behaviours and potential dangers while online
- co-create classroom protocols to follow to be responsible and stay safe online
- describe how to use suitable digital platforms and tools for sharing and collaboration
- identify online activities that contribute to their digital footprint
- develop skills in using documents collaboratively following conventions
- efficiently plan tasks and collaborate online following agreed behaviours and protocols.
Resources to include
Resources to introduce
-
Online safety classroom agreement
Find out more -
What does being respectful and responsible online look like?
Find out more -
Online collaboration
Find out more -
Play it safe and fair online
Find out more


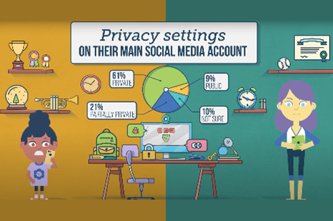

Years 5–6 Online safety classroom agreement
Use this resource to co-create an online safety classroom agreement with your students that defines, highlights and encourages safe and respectful online behaviours.
Requires
- internet access
- teacher laptop connected to whiteboard to view resources as a class
- downloaded and printed agreement
Suggested time
1 hourEnables students to:
- describe ways to be respectful and responsible online
- describe the 'esafe' approach that aims to create an online environment that is safe, supportive and inclusive.

Years 5–6 What does being respectful and responsible online look like?
Use this resource to discuss protocols of online communication.
Requires
- internet access
- computers, laptops or tablets; or a whiteboard to view resource as a class
Suggested time
30 minutesEnables students to:
- describe ways to be respectful and responsible online
- describe potential dangers while online.

Years 5–6 Online collaboration
Use this resource to discuss protocols of online communication.
Requires
- internet access
- teacher laptop connected to whiteboard to view resource as a class
Suggested time
30 minutesEnables students to:
- describe ways to be respectful and responsible online
- describe potential dangers while online.

Years 5–6 Play it safe and fair online
This video-based resource features three top Australian athletes who share their tips about how to play it safe and fair online.
Requires
- internet access
- computers, laptops or tablets; or a whiteboard to view video as a class
Suggested time
7 minutesEnables students to:
- describe ways to be respectful and responsible online
- describe potential dangers while online.
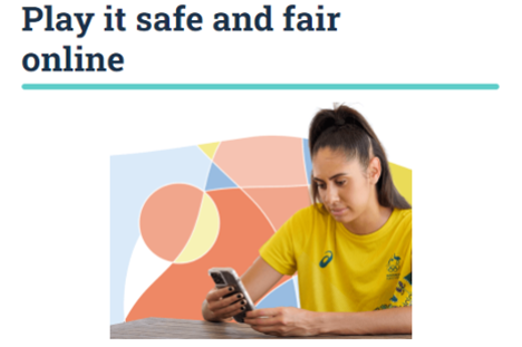
Resources to develop and consolidate learning
-
Privacy and security
Find out more -
What are digital footprints?
Find out more -
Your digital footprint
Find out more -
Your online data
Find out more
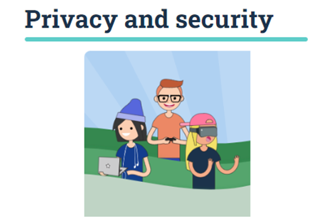


Years 5–6 Privacy and security
This classroom activity is designed to empower students to protect their online privacy and personal information that identifies them. Students will learn about the skills required to create safer online environments.
Requires
- internet access
- computers, laptops or tablets; or a whiteboard to view resource as a class
- printed worksheets
Suggested time
1 hourEnables students to:
- describe ways to protect their personal information online
- describe potential dangers while online.
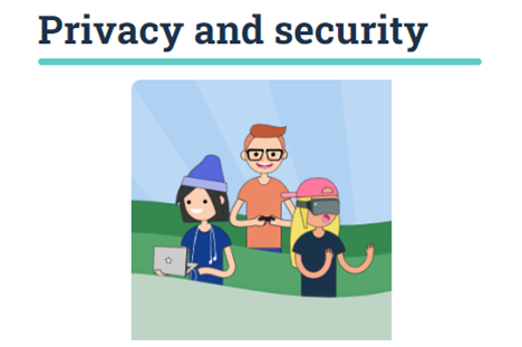
Years 5–6 What are digital footprints?
Use this resource to discuss dangers online and the trail they leave as they explore the internet.
Requires
- internet access
- computers, laptops or tablets; or a whiteboard to view resource as a class
Suggested time
30 minutesEnables students to:
- describe how their online activity leaves a trail (digital footprint)
- describe ways to protect their personal information online
- describe potential dangers while online.
Years 5–6 Your digital footprint
Use this resource to help students learn about the similarities of staying safe in the real world and when online, and explore what information is appropriate to be put online to manage their digital footprint.
Requires
- internet access
- computers, laptops or tablets; or a whiteboard to view resource as a class
Suggested time
1 hourEnables students to:
- describe how their online activity leaves a trail (digital footprint)
- describe ways to protect their personal information online
- describe potential dangers while online.
Years 5–6 Your online data
Use this resource to discuss the trail your digital footprint leaves as it becomes a record of your online explorations, preferences, habits and behaviour.
Requires
- internet access
- computers, laptops or tablets; or a whiteboard to view resource as a class
- printed worksheet
Suggested time
30 minutesEnables students to:
- describe how their online activity leaves a trail (digital footprint)
- describe ways to protect their personal information online
- describe potential dangers while online.

Resources to apply and extend learning
-
Cybersmart challenges
Find out more -
Be Deadly Online
Find out more -
Making good choices online
Find out more


Years 5–6 Cybersmart challenges
Teacher-led activities using animated videos to introduce students to key online safety issues including cyberbullying, protecting personal information and sharing images.
Requires
- choose from a range of lessons
- printable worksheets and slides
Suggested time
1-3 hoursEnables students to:
- identify problematic situations that may impact their online safety of security
- describe ways to stay safe online.
Years 5–6 Be Deadly Online
Explores cyberbullying, sexting, digital reputation and respect for others. It includes lesson plans, short videos and posters created with First Nations peoples for their own community.
Requires
- choose from a range of lessons
- printable worksheets and slides
Suggested time
1-3 hoursEnables students to:
- identify problematic situations that may impact their online safety of security
- identify ways to stay safe online that protects First Nations peoples' identity, culture and connections.

Years 5–6 Making good choices online
The presentation explores three different scenarios asking students to place themselves in the shoes of Tom’s character and decide what he should do in each online situation using the think, evaluate, choose (TEC) model.
Requires
- internet access
- computers, laptops or tablets
- electronic whiteboard to view slides as a class
Suggested time
1 hourEnables students to:
- describe ways to be a responsible user in an online environment
- understand the need to discuss choices with a trusted adult.

Further reading and professional learning
-
Curriculum connection: Online safety
Find out more -
Tips for online collaboration tools
Find out more

Years 5–6 Curriculum connection: Online safety
Refer to this ACARA resource to learn more about connections to the curriculum related to online safety.
Suggested time
30 minutes
Years 5–6 Tips for online collaboration tools
Refer to this eSafety Commissioner resource to learn more about setting up a safe learning environment for students when collaborating online.
Suggested time
30 minutes
Collaboration and project
What is this about?
As students work collaboratively on a digital project they will use a range of digital tools to plan, locate, create and share content. Collaboration often involves creating a shared space such as a place for an online document to enable group members to contribute and have access to the most up-to-date version. Depending on your school, common platforms that enable online collaboration include Google Workspace for Education and Microsoft 365. As students use these types of platforms, they follow agreed protocols related to digital etiquette, privacy and safety.
Students will learn to effectively select and use digital tools for collaborative work, task planning and demonstrating agreed behaviours and conventions such as awareness of version history. They are introduced to relevant collaboration tools to engage and share content in group projects. They will learn to use these tools and develop skills to promote teamwork and follow agreed online protocols and behaviours.
Content descriptions
Select and use appropriate digital tools effectively to create, locate and communicate content, applying common conventions AC9TDI6P07
Select and use appropriate digital tools effectively to share content online, plan tasks and collaborate on projects, demonstrating agreed behaviours AC9TDI6P08
This sequence enables students to:
- select and use suitable digital platforms and tools for sharing and collaboration
- develop skills in using documents collaboratively following conventions
- efficiently and responsibly collaborate online following agreed behaviours and protocols.
Resources to include
Resources to introduce
-
Search technologies
Find out more -
Fact or fake – is information on the web always reliable?
Find out more -
Join a padlet
Find out more -
Freeform for iPad
Find out more -
Collaborating using IT
Find out more -
Digital learning selector
Find out more -
Collaborate with Microsoft 365
Find out more


Years 5–6 Search technologies
Use this resource to discuss search engine basics such as using key words and ranking. The resource contains a video that is not accessible in our region; however, a transcript is available.
Requires
- internet access
- computers, laptops or tablets
Suggested time
30 minutesEnables students to:
- describe the type of content available on the internet
- describe how to use a search engine to locate content available on the internet
- describe ways to stay safe online.

Years 5–6 Fact or fake – is information on the web always reliable?
When locating information students need to be aware of whether a site is credible
Requires
- internet access
- computers, laptops or tablets
Suggested time
30 minutesEnables students to:
- describe the type of content available on the internet
- describe how to use a search engine to locate content available on the internet
- describe ways to stay safe online.

Years 5–6 Join a padlet
Create a padlet and enable your students to access and share content online without needing an email (this helps to ensure data privacy and protecting student data).
Requires
- internet access
- computers, laptops or tablets
- teacher access to padlet app and created padlet to share with students on a selected topic
Suggested time
30 minutesEnables students to:
- share content safely online
- follow agreed protocols when sharing information online.

Years 5–6 Freeform for iPad
Use this brainstorming tool to set up class collaboration-focused activities
Requires
- iPads
- register for use (two-month free trial then requires a paid subscription)
Suggested time
1 hourEnables students to:
- share content and collaborate using agreed behaviours.
Years 5–6 Collaborating using IT
Use this resource to discuss collaboration, what it is and the different ways we can collaborate to complete a task.
Requires
- internet access
- computers, laptops or tablets
Suggested time
30 minutesEnables students to:
- describe ways to collaborate to complete a task
- describe ways to collaborate online
- describe ways to collaborate following agreed behaviours and protocols.
Years 5–6 Digital learning selector
Use this resource to find out about, and select, relevant collaboration tools that meet the needs of your school, students and context.
Requires
- gather necessary tools and access to digital platforms
Suggested time
30 minutesEnables students to:
- explore various digital tools for collaboration and sharing content.

Years 5–6 Collaborate with Microsoft 365
Use this brief video (1 min 23 sec) to discuss how to share a document and ways to collaborate such as suggesting edits in an online document.
Requires
- school version of Office 365
- laptop, computer access with internet connectivity
Suggested time
1 minutesEnables students to:
- use the collaborative features of a collaborative tool to give feedback or co-author a document.

Resources to develop and consolidate learning
-
How to use Microsoft documents without an email
Find out more -
Collaborate on Word documents with real-time co-authoring
Find out more -
Getting started with Google Classroom
Find out more -
Collaborating with Google Classroom
Find out more


Years 5–6 How to use Microsoft documents without an email
Use this resource to discuss how to share a document without the need for email (via a shared link).
Requires
- school version of Office 365
- laptop, computer access with internet connectivity
Suggested time
30 minutesEnables students to:
- use the collaborate features of a collaborative tool to give feedback or co-author a document.

Years 5–6 Collaborate on Word documents with real-time co-authoring
Use this resource for an overview of how to collaborate on a Word document.
Requires
- school version of Office 365
- laptop, computer access with internet connectivity
Suggested time
30 minutesEnables students to:
- use the collaborate features of a collaborative tool to give feedback or co-author a document.
Years 5–6 Getting started with Google Classroom
If your school has access to Google Classroom, use the collaborative tools to share content.
Requires
- internet access
- computers, laptops or tablets
- electronic whiteboard to view slides as a class
Suggested time
30 minutesEnables students to:
- share content safely online
- follow agreed protocols when sharing information online.

Years 5–6 Collaborating with Google Classroom
Use this resource to learn more about ways to support your students to collaborate online using agreed protocols. Refer to the ‘Praise, Question, Suggest’ Protocol document (Strategy Resources section).
Requires
- printed worksheet 'Praise, Question, Suggest' Protocol
- internet access
- teacher laptop connected to whiteboard to view resource (includes video) as a class
Suggested time
1 hourEnables students to:
- provide and accept feedback following agreed behaviours and protocols.
Resources to apply and extend learning
-
Class blog
Find out more -
My digital portfolio
Find out more -
Share your Canva design and collaborate with anyone
Find out more


Years 5–6 Class blog
In this lesson sequence students investigate features of a good blog, focusing on such things as the concept, purpose, audience and critical features.
Requires
- internet access
- computers, laptops or tablets
- access to suitable website creation software (if students create their own website)
Suggested time
2-3 hoursEnables students to:
- know and understand how a website is used to provide content
- describe how to navigate and use a website
- describe the purpose of their website to share content with their potential audience
- provide and accept feedback following agreed behaviours and protocols.

Years 5–6 My digital portfolio
Students create their own website to record and present their learning. As part of the process, students respectfully and constructively comment on each other’s webpage.
Requires
- internet access
- computers, laptops or tablets
- access to suitable website creation software (if students create their own website)
Suggested time
2-3 hoursEnables students to:
- know and understand how a website is used to provide content
- describe how to navigate and use a website
- describe the purpose of their website to share content with their potential audience
- provide and accept feedback following agreed behaviours and protocols.
Years 5–6 Share your Canva design and collaborate with anyone
Use this guide to show students how to collaborate with another student. They can share a link that lets other students edit their design.
Requires
- register for a Canva education account
- laptop, computer access with internet connectivity
Suggested time
30 minutesEnables students to:
- use the collaborate features of a collaborative tool to give feedback or co-author a document
- provide and accept feedback following agreed behaviours and protocols.

Further reading and professional learning
-
Curriculum connection: Online safety
Find out more -
eSafety Commisioner's risk assessment tool
Find out more

Years 5–6 Curriculum connection: Online safety
Refer to this ACARA resource to learn more about connections to the curriculum related to online safety.
Suggested time
30 minutes
Years 5–6 eSafety Commisioner's risk assessment tool
Before using any of the collaborative tools, be sure to conduct a risk assessment. For a comprehensive risk assessment, view the eSafety Commissioner’s risk assessment tool.
Suggested time
30 minutes
App design
Overview
This unit enables students to explore app design, through a process of problem definition, prototyping and evaluation. Students explore concepts of user interface design, design criteria and user stories. They use visual programs including variables, input and control structures to produce an app.
Achievement standards
By the end of Year 6 students develop and modify digital solutions, and define problems and evaluate solutions using user stories and design criteria. Students design algorithms involving complex branching and iteration and implement them as visual programs including variables.
Australian Curriculum
Content descriptions
Investigating and defining AC9TDI6P01
Generating and designing AC9TDI6P02, AC9TDI6P03, AC9TDI6P04
Producing and implementing AC9TDI6P05
Evaluating AC9TDI6P06
Related content and General Capabilities
Related content:
The Arts: Media Arts AC9AMA6C01
Design and Technologies AC9TDE6P01, AC9TDE6P02, AC9TDE6P04
General capability:
Critical and Creative Thinking
Digital Literacy
This topic enables students to
- investigate and develop user stories to understand defined problems
- use paper prototyping to explore app functionality and user experience
- plan and design algorithms using wireframes and flowcharts
- ideate a range of possible solutions using design criteria
- develop and edit programs using a visual programming environment
- evaluate and suggest modifications if design ideas do not satisfy design criteria and user stories.
Watch this video for a quick overview of the unit and how to use its resources with your students.
Assessment View assessment advice
Achievement standards
By the end of Year 6 students develop and modify digital solutions, and define problems and evaluate solutions using user stories and design criteria. Students design algorithms involving complex branching and iteration and implement them as visual programs including variables.
Use this rubric to assess students’ proficiency in:
- algorithm implementation
- user interface design
- algorithm design with branching and iteration
- problem definition and solution evaluation.
Rubric: Algorithm implementation and design, User interface design, and Evaluation
| Algorithm implementation | shows some ability to implement algorithms as visual programs, with basic control structures, variables and input | implements algorithms involving control structures, variables and input, with occasional need for assistance | implements algorithms as visual programs, showing independent use of control structures, variables and input | implements algorithms independently, demonstrating ability to generate, modify, communicate and evaluate designs involving complex control structures, variables and input |
| User interface design | with guidance can design a user interface for a digital system, showing limited understanding of fundamental design principles | designs a user interface for a digital system with basic elements, with occasional need for support | designs a user interface, demonstrating an understanding of design principles and creating effective digital system interfaces | designs user interfaces incorporating innovative elements and showing a deep understanding of design principles for optimal user experience |
| Algorithm design with branching and iteration | with guidance can design algorithms involving multiple alternatives (branching) and iteration | designs algorithms with branching and iteration, with occasional need for assistance | designs algorithms involving multiple alternatives and iteration independently | designs complex algorithms, demonstrating creativity and efficiency in handling multiple alternatives through branching and iteration |
| Problem definition and solution evaluation | with guidance can define problems with design criteria and create user stories, showing limited understanding of the process | defines problems with given or co-developed design criteria and creates user stories, with occasional need for support | defines problems, co-develops design criteria, and creates comprehensive user stories, effectively guiding the development process | defines intricate problems, collaboratively develops design criteria, and creates detailed user stories; critically evaluates existing and student solutions against design criteria and broader community impact, showing a holistic understanding of the development process |
Unit sequence
The four sequences in this unit are designed to be covered in order.
Unit 1
Investigating and defining problems
Students explore the fundamental skills of empathising and problem identification within the design thinking process.Unit 2
Generating design ideas
Students engage in activities that cultivate their ability to generate and modify designs, fostering creativity and adaptability.Unit 3
Creating and implementing algorithms
Students use visual programming languages or environments to depict the logical flow, control structures, variables and input interactions of a computer program.Unit 4
Evaluating
This final sequence guides students in evaluating solutions created by them against specific design criteria and user stories.Investigating and defining problems
What is this about?
This entails teaching students the fundamental skills of empathising and problem identification within the design thinking process. It emphasises two critical aspects: first, crafting user stories that narrate how users interact with a situation or task to identify problems, and second, identifying and developing design criteria that provide specific objectives and requirements for addressing problems. This educational objective is versatile, and equips students with the essential skills of problem-solving and effective communication within specified guidelines, a valuable skill set for diverse problem-solving scenarios.
Content description
Define problems with given or co-developed design criteria and by creating user stories AC9TDI6P01
This sequence enables students to:
- empathise as part of the design thinking process
- explore and develop user stories
- consider and create design criteria.
Resources to include
Resources to introduce
-
Introduction to apps
Find out more -
Empathy in UX design
Find out more -
Empathy map template
Find out more -
Step in – step out – step back
Find out more -
Intro to user stories
Find out more


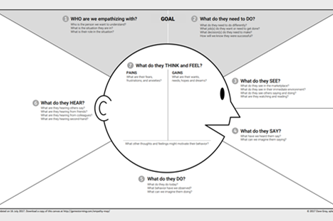

Years 5–6 Introduction to apps
Use this lesson to introduce the concept of apps and explore what makes an app an app.
Requires
- resources as provided on the code.org website
Suggested time
45 minutesEnables students to:
- identify the inputs, outputs and purpose of an app.
Years 5–6 Empathy in UX design
Use this website to support students to empathise with the user as part of the first stage of the design thinking process.
Requires
- computers, laptops or tablets; or view as a class on interactive whiteboard
Suggested time
45 minutesEnables students to:
- describe what it means to empathise within the design process.

Years 5–6 Empathy map template
Use this worksheet to support students to empathise with the user as part of the first stage of the design thinking process.
Requires
- printed worksheet (provided)
Suggested time
30 minutesEnables students to:
- describe what it means to empathise within the design process
- use an empathy map to describe the needs of a user.
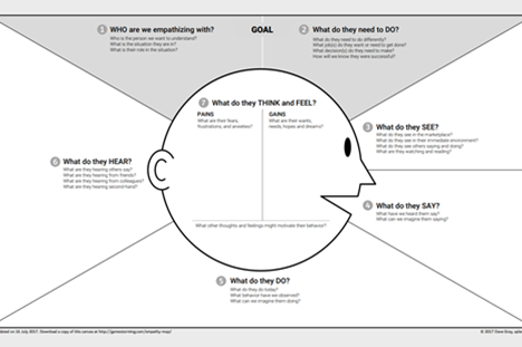
Years 5–6 Step in – step out – step back
Use this visible thinking routine from Harvard’s Project Zero to further develop an understanding of the user.
Requires
- view article
Suggested time
30 minutesEnables students to:
- use a thinking routine to understand the user, taking different perspectives into account.
Years 5–6 Intro to user stories
View the video ‘How to write great user stories’ (2.5 min) and use this resource to support students to understand how to create user stories.
Requires
- computers, laptops or tablets; or view as a class on interactive whiteboard
Suggested time
45 minutesEnables students to:
- describe elements of a user story
- explain why a user story is an important part of the design process.
Resources to develop and consolidate learning
-
Circle of viewpoints
Find out more -
Designing with empathy
Find out more -
Developing user stories
Find out more -
Developing design criteria
Find out more


Years 5–6 Circle of viewpoints
This thinking routine helps students see and explore multiple perspectives. It helps them understand that different people can have different kinds of connections to the same thing, and that these different connections influence what people see and think.
Requires
- view article
Suggested time
30 minutesEnables students to:
- explore topics and ideas from multiple perspectives
- use a thinking routine to understand the user, taking multiple perspectives into account.

Years 5–6 Designing with empathy
Use this lesson to encourage students to think more broadly about what it means to consider the end user of a product before homing in on how it specifically applies to programming.
Requires
- resources as provided on the code.org website
Suggested time
30 minutesEnables students to:
- critically evaluate an object for how well its design meets a given set of needs
- identify empathy for the user as an important component of the design process.
Years 5–6 Developing user stories
Use these slides to support and guide students to develop a user story as part of the ideation phase of the design process.
Requires
- slides (PowerPoint)
Suggested time
1 hourEnables students to:
- identify needs of a user
- create a user story
- explain how a user story is used in the design process.
Years 5–6 Developing design criteria
Use this worksheet to help students review the user story and consider key functions within app design. Students can brainstorm and complete the sections to create their own design criteria.
Requires
- printed worksheet
Suggested time
45 minutesEnables students to:
- develop their own design criteria based on user stories
- consider key features of an app.

Further reading and professional learning
-
Designing an AI-driven solution
Find out more -
Design Thinking Mix-in (teacher workbook)
Find out more -
Stage 1 in the design thinking process: empathise with your users
Find out more -
Design Thinking 101
Find out more

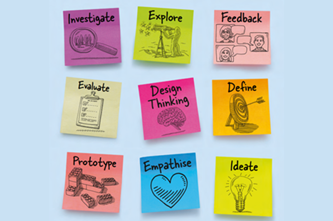
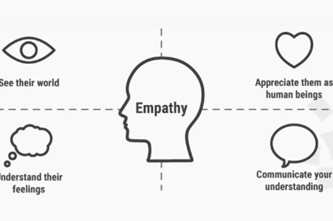
Years 5–6 Designing an AI-driven solution
This module explores the process of design, focusing on designing AI-driven solutions that benefit the user and society.
Suggested time
1 hour
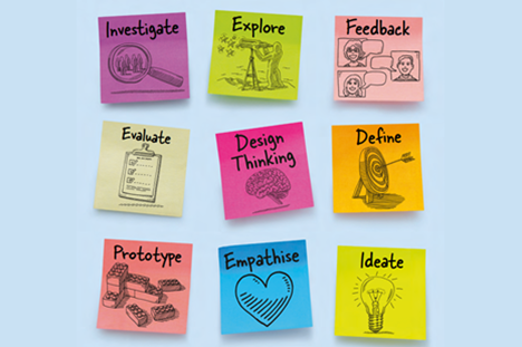
Years 5–6 Stage 1 in the design thinking process: empathise with your users
Suggested time
30 minutes
Generating design ideas
What is this about?
Students engage in activities that cultivate their ability to generate and modify designs, fostering creativity and adaptability. Skills are honed through the integration of visual tools, ensuring effective demonstration of design concepts. Students focus on user interface (UI) design for digital systems by exploring ideas in the ideation phase of design thinking, and developing interactive prototyping. They are also introduced to algorithmic design and explore concepts including flowcharts, pseudocode, branching and iteration.
These components could converge in a project-based learning approach, where students apply their skills to an integrated project, demonstrating their proficiency in design thinking, UI design and algorithmic problem-solving. The learning sequence emphasises reflection and continuous improvement, fostering a culture of iteration and refinement in students' design and algorithmic choices.
Content descriptions
Design algorithms involving multiple alternatives (branching) and iteration AC9TDI6P02
Design a user interface for a digital system AC9TDI6P03
Generate, modify, communicate and evaluate designs AC9TDI6P04
This sequence enables students to:
- ideate as part of the design thinking process
- explore and develop algorithmic thinking
- consider and design user interfaces for a particular user
- undertake prototyping.
Resources to include
Resources to introduce
-
Google UX design: the design thinking process
Find out more -
Wireframing
Find out more -
UI/UX design module
Find out more


Years 5–6 Google UX design: the design thinking process
View this video to teach students about the ideation phase of the design thinking process.
Requires
- computers, laptops or tablets; or view as a class on interactive whiteboard
Suggested time
33 minutesEnables students to:
- describe the basic concept of ideation as part of the design thinking process.
Years 5–6 Wireframing
A wireframe is a sketch of a digital interface that details the key elements or skeleton of the design. View the video for an introduction to wireframes and how they are used in the UX design process. Use the text on the website as prompts for class discussions.
Requires
- computers, laptops or tablets; or view as a class on interactive whiteboard
Suggested time
10 minutesEnables students to:
- describe the benefits of wireframing in UX design
- describe ways in which wireframing is different from functional prototyping.
Years 5–6 UI/UX design module
In this Grok course students will learn about UX and UI.
Requires
- register for free use of this tutorial and assign students to this task
- internet access
- computers, laptops or tablets
Suggested time
2 hoursEnables students to:
- describe the basics of design
- explain why we use prototyping with wireframes
- apply design principles effectively.

Resources to develop and consolidate learning
-
Design an app
Find out more -
Guide to paper prototyping
Find out more -
Paper prototyping
Find out more -
Mobile application design: paper prototype video
Find out more -
Apple App Design Workbook
Find out more -
Using flowcharts to design algorithms
Find out more -
Adobe Color
Find out more


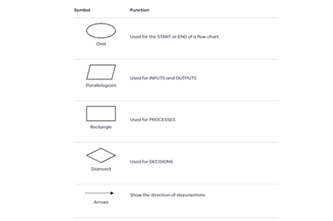

Years 5–6 Design an app
Use this lesson to help students to brainstorm ideas and start the process of app development.
Requires
- resources as provided on the website
Suggested time
90 minutesEnables students to:
- brainstorm and choose a topic to develop into an app
- create a UI based on a prototype
- design the UI of an app
- use feedback to help guide the design of an app.
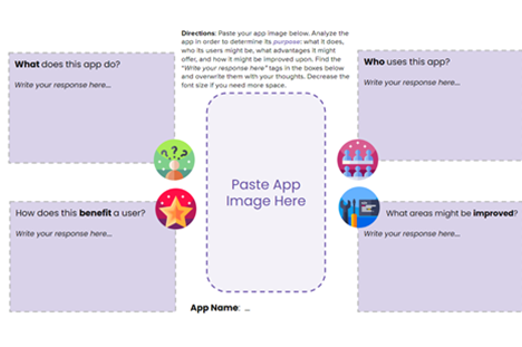
Years 5–6 Guide to paper prototyping
Use this website to help students understand paper prototyping and its relevance in the app design process.
Requires
- internet access
- computers, laptops or tablets
Suggested time
30 minutesEnables students to:
- develop ideas and understand UI design
- describe elements that impact UX.

Years 5–6 Paper prototyping
Use this website to guide creating paper prototypes and get tips on testing early designs.
Requires
- internet access
- computers, laptops or tablets
- printed templates to create their prototype
Suggested time
2 hoursEnables students to:
- develop ideas and understand UI design
- describe elements that impact UX
- create a paper prototype.
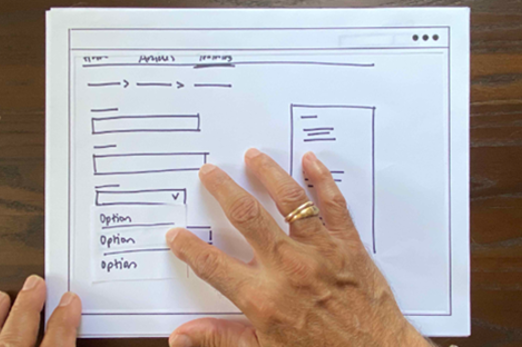
Years 5–6 Mobile application design: paper prototype video
Use this video to illustrate designing and evaluating a paper prototype for an app.
Requires
- paper
Suggested time
1 minuteEnables students to:
- develop ideas and understand UI design
- describe elements that impact UX.

Years 5–6 Apple App Design Workbook
Use this workbook to guide students through the design thinking process to develop their app ideas. Note: Many parts of the workbook can be used without the Swift Playgrounds elements.
Requires
- Swift Playgrounds app (requires Apple device)
- Keynote (or PowerPoint) for prototyping
Enables students to:
- use the design thinking process to build and develop app design and basic programming concepts.

Years 5–6 Using flowcharts to design algorithms
Use this lesson plan to introduce students to algorithmic thinking through flowcharts and to support students to begin to understand the complexity and sequential aspect of algorithms.
Requires
- computers, laptops or tablets; or view as a class on interactive whiteboard
Suggested time
40 minutesEnables students to:
- build algorithmic thinking
- design algorithms.
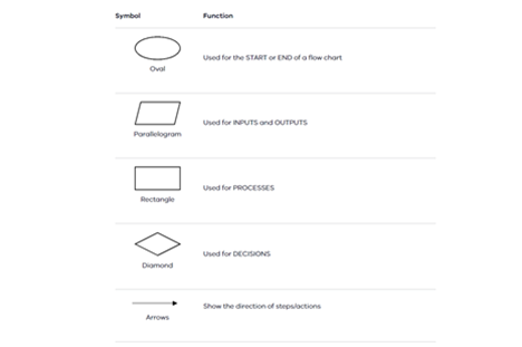
Years 5–6 Adobe Color
Students use the interactive colour wheel to experiment with and explore colour schemes as part of UI design, including: monochromatic (take one hue and create other elements from different shades and tints of it), analogous (colours beside each other on the colour wheel), complementary (opposite colours to maximise contrast), split complementary (colours from either side of the complementary colour pair to soften contrast) and triadic (three equidistant colours) colour harmonies.
Requires
- internet access
- computers, laptops or tablets
Suggested time
20 minutesEnables students to:
- make colour choices for UI design
- describe why colour is an important part of design.
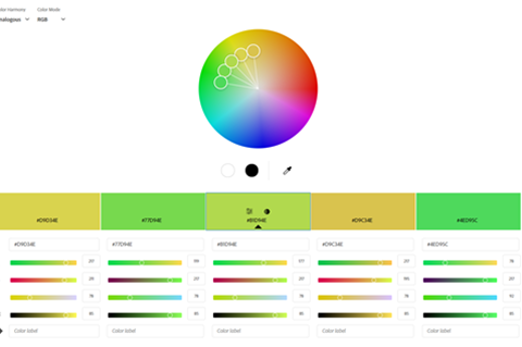
Resources to apply and extend learning
-
Keynote prototyping
Find out more -
Google Slides prototyping
Find out more -
PowerPoint prototyping
Find out more -
Details Pro
Find out more
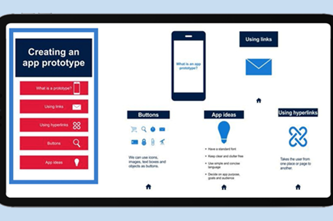
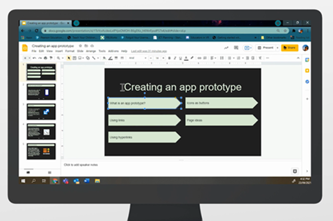
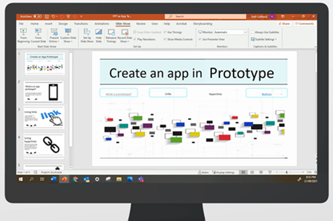
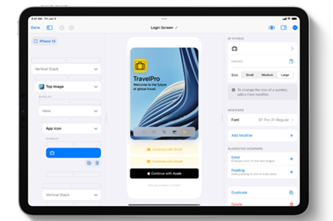
Years 5–6 Keynote prototyping
Use this video (3.5 min) to teach students how to use Keynote for app prototyping. Keynote offers students a user-friendly platform to prototype app designs, focusing on UI and UX considerations. Students can visually represent different screens and interactions within an app, experimenting with layout, colour and interactive elements.
Requires
- internet access
- teacher laptop and interactive whiteboard to view video as a class
- Apple device (iPad/Mac)
Suggested time
2–3 hoursEnables students to:
- design UI prototypes
- design UX prototypes
- build interactive prototypes.
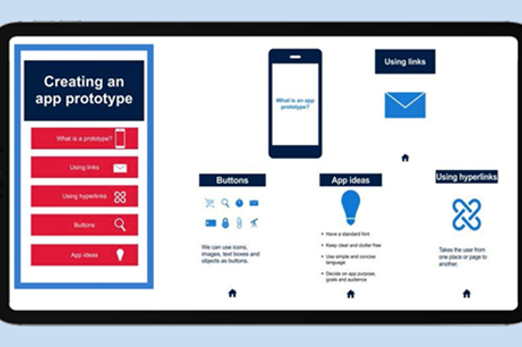
Years 5–6 Google Slides prototyping
Use this video (6 min) to teach students how to use Google Slides for app prototyping. Google Slides offers students a user-friendly platform to prototype app designs, focusing on UI and UX considerations. Students can visually represent different screens and interactions within an app, experimenting with layout, colour and interactive elements.
Requires
- internet access
- teacher laptop and interactive whiteboard to view video as a class
- computers, laptops or tablets
Suggested time
2–3 hoursEnables students to:
- design UI prototypes
- design UX prototypes
- build interactive prototypes.
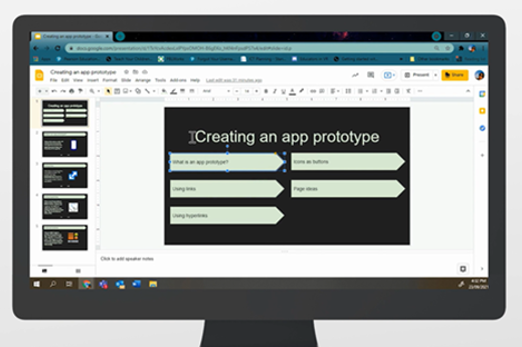
Years 5–6 PowerPoint prototyping
Use this video (4.5 min) to teach students how to use PowerPoint for app prototyping. PowerPoint offers students a user-friendly platform to prototype app designs, focusing on UI and UX considerations. Students can visually represent different screens and interactions within an app, experimenting with layout, colour and interactive elements.
Requires
- internet access
- teacher laptop and interactive whiteboard to view video as a class
- computers, laptops or tablets
Suggested time
2–3 hoursEnables students to:
- design UI prototypes
- design UX prototypes
- build interactive prototypes.
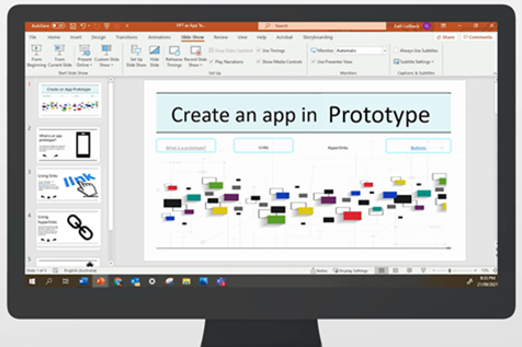
Years 5–6 Details Pro
Details Pro app is a more advanced prototyping tool with a feature-rich interface. Students can create detailed and interactive prototypes, incorporating intricate design elements such as navigation flows, animations and dynamic interactions. Details Pro facilitates a high-fidelity representation of app interfaces, allowing students to refine and test their designs more comprehensively.
Requires
- Apple device (iPad/Mac)
- computers, laptops or tablets
Suggested time
2+ hoursEnables students to:
- design apps with SwiftUI without code.
Further reading and professional learning

Years 5–6 User interface design overview
This 5-minute video gives an overview of UI design for teachers.
Suggested time
5 minutes
Years 5–6 Creating mobile app wireframes
This resource presents a comprehensive and practical framework for teaching students the intricacies of mobile app wireframing, fostering a holistic understanding of the design process.
Suggested time
30 minutes
Creating and implementing algorithms
What is it about?
This involves using visual programming languages or environments to depict the logical flow, control structures, variables and input interactions of a computer program. By implementing control structures, such as loops and conditional statements, students gain a visual understanding of program logic. Working with variables, they learn to declare, assign and manipulate data placeholders. Students incorporate user input to help ensure that interactions within their visual programs can be effectively handled.
Content description
Implement algorithms as visual programs involving control structures, variables and input AC9TDI6P05
This sequence enables students to:
- debug simple sequential and event-driven programs, employing the debugging process and identifying best practices
- describe branching, including conditionals like if/else statements, and grasp iteration concepts related to loops
- describe variables, their role within algorithms, and use appropriate vocabulary to describe variables, expressions and variable assignment
- explore user input within visual programs, understand how it influences output, and practise code editing for varied outcomes
- implement algorithms as visual programs, construct app designs, write programs with branching and iteration, and use control structures within visual programming to extend their programming knowledge and understanding.
Resources to include
Resources to introduce
-
Debugging
Find out more -
Branching – Conditionals: If and If/Else Statements
Find out more -
Conditionals - Part 2 If/Else Statements
Find out more -
Intro to Programming: Loops
Find out more -
Intro to variables
Find out more -
Variables: Explore
Find out more -
Text input/area demo
Find out more

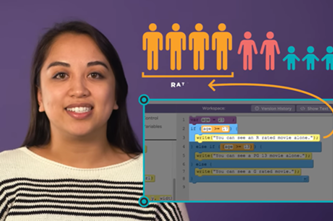


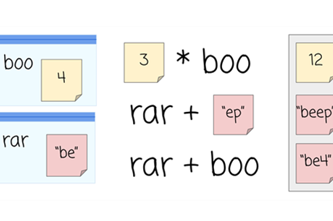
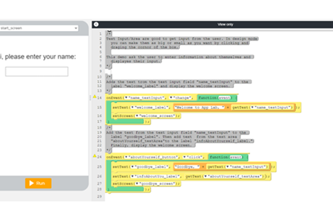
Years 5–6 Debugging
This lesson introduces students to the concept of debugging. This emphasis on debugging enhances students' problem-solving skills and fosters a deeper understanding of programming principles.
Requires
- resources as provided on the code.org website
Suggested time
45 minutesEnables students to:
- debug simple sequential and event-driven programs
- use the debugging process and identify specific best practices for debugging programs.
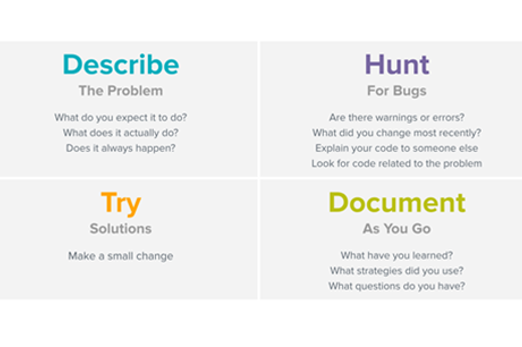
Years 5–6 Branching – Conditionals: If and If/Else Statements
This video is a valuable resource to help students grasp the concept of branching within visual programming. By incorporating the vocabulary of conditionals and if/else statements, the videos guide students through the intricacies of decision-making structures in coding.
Requires
- internet access
- teacher laptop and interactive whiteboard to view video as a class
Suggested time
10 minutesEnables students to:
- describe branching (conditionals: if and if/else statements)
- identify or give an example of branching in a visual program.
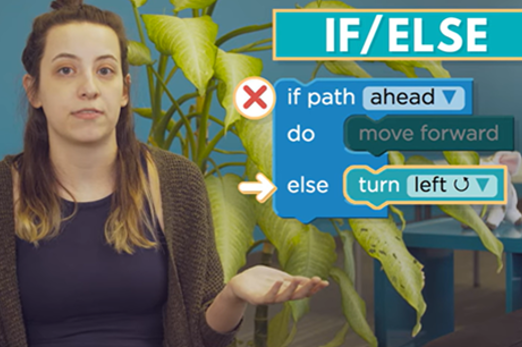
Years 5–6 Conditionals - Part 2 If/Else Statements
This video is a valuable resource to help students grasp the concept of branching within visual programming. By incorporating the vocabulary of conditionals and if/else statements, the videos guide students through the intricacies of decision-making structures in coding.
Requires
- internet access
- teacher laptop and interactive whiteboard to view video as a class
Suggested time
10 minutesEnables students to:
- describe branching (conditionals: if/else statements)
- identify or give an example of branching in a visual program.
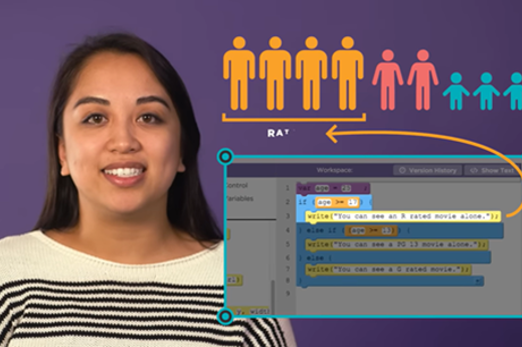
Years 5–6 Intro to Programming: Loops
View this video to explore loops which are a fundamental concept in programming. In this video we use the example of using a loop when programming steps in the frosting of a cupcake.
Requires
- internet access
- teacher laptop and interactive whiteboard to view video as a class
Suggested time
2 minutesEnables students to:
- describe iteration (loops) and how it is used in a visual program.

Years 5–6 Intro to variables
This video helps students understand the fundamental concept of variables within visual programming. A variable is a symbolic name for a storage location that holds a value, allowing for the manipulation and representation of data within a computer program.
Requires
- internet access
- teacher laptop and interactive whiteboard to view video as a class
Suggested time
5 minutesEnables students to:
- describe variables and how they are used in a visual program.
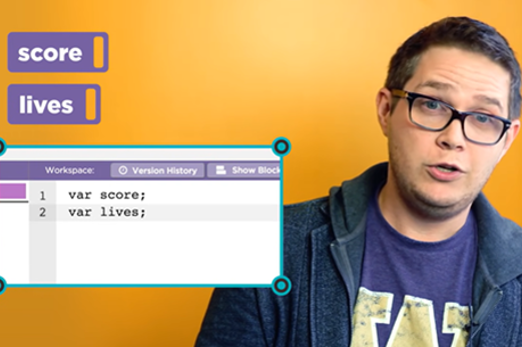
Years 5–6 Variables: Explore
Use this lesson plan to facilitate a hands-on unplugged activity involving plastic bags and sticky notes. This enables students to construct a mental model illustrating how variables function in moving and storing information.
Requires
- resources as provided on the code.org website
Suggested time
45 minutesEnables students to:
- understand how variables work within algorithms
- use appropriate vocabulary to describe variables, expressions and variable assignment.
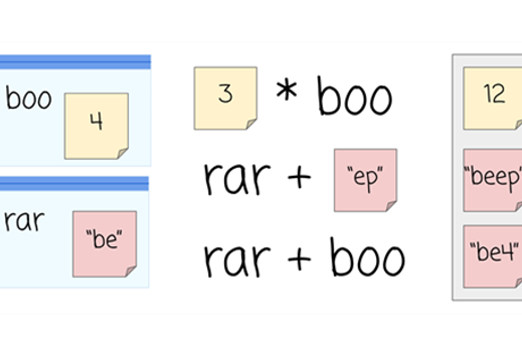
Years 5–6 Text input/area demo
The App Lab program is an invaluable tool in guiding students through the process of learning how to program apps. Specifically, the program's demonstration of text input enhances students’ understanding of user input within visual programming. By showcasing how to incorporate and manipulate text through a visual interface, students gain practical insights into handling user interactions in their app designs. Students can edit and manipulate code to experiment with input and output.
Requires
- internet access
- computers, laptops or tablets
- requires free registration App Lab.
Suggested time
30 minutesEnables students to:
- explore user input within visual programs
- consider how user input is used to create output
- practise editing code to get different outputs.
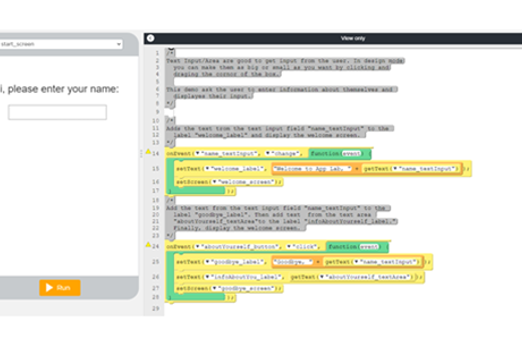
Resources to develop and consolidate learning
-
Scratch programming
Find out more -
Example Scratch app
Find out more -
Thunkable
Find out more -
MIT App Inventor
Find out more
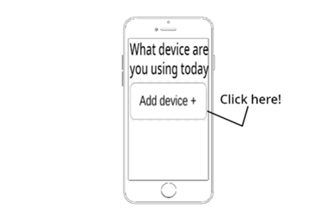
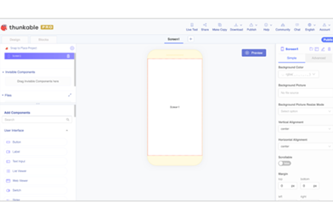

Years 5–6 Scratch programming
Students can use Scratch to design and program apps using visual programming.
Requires
- internet access
- computers, laptops or tablets
Suggested time
45 minutesEnables students to:
- implement algorithms as visual programs
- build simple app designs
- write a visual program with branching and iteration
- use control structures within visual programs.

Years 5–6 Example Scratch app
(Prototype 2 app design) This is an example of what could be created by students. It could be introduced to students to remix and to investigate the programming blocks used in the program.
Requires
- internet access
- computers, laptops or tablets
Suggested time
1 hourEnables students to:
- implement algorithms as visual programs
- build simple app designs
- write a visual program with branching and iteration
- use control structures within visual programs.
Years 5–6 Thunkable
This platform provides an accessible entry point for students to learn various aspects of programming, UI design and app development. Thunkable lets users visually design app interfaces, encouraging an understanding of UI principles and design aesthetics. Students can experiment with real-time app development and test their creations on iOS and Android devices.
Requires
- internet access
- computers, laptops or tablets
Suggested time
2+ hoursEnables students to:
- implement algorithms as visual programs
- build simple app designs
- write a visual program with branching and iteration
- use control structures within visual programs.
Years 5–6 MIT App Inventor
This platform uses a visual, block-based programming approach, allowing users to create Android applications without the need for extensive coding knowledge. The website provides many resources, including tutorials, forums and documentation, to support learners at every stage of their app development journey.
Requires
- internet access
- computers, laptops or tablets; or view as a class on interactive whiteboard
Suggested time
2+ hoursEnables students to:
- implement algorithms as visual programs
- build simple app designs
- write a visual program with branching and iteration
- use control structures within visual programs.
Resources to apply and extend learning

Years 5–6 App Lab
This self-paced module introduces foundational concepts of computer programming, which unlocks the ability to make rich, interactive apps. This unit uses JavaScript as the programming language and App Lab as the programming environment to build apps, but the concepts learned in these lessons span all programming languages and tools.
Requires
- internet access
- computers, laptops or tablets
- free registration App Lab
Suggested time
2 hoursEnables students to:
- extend programming knowledge and understanding
- implement algorithms as visual programs
- build simple app designs
- write a visual program with branching and iteration
- use control structures within visual programs.
Years 5–6 Swift Playgrounds
This interactive learning environment, developed by Apple, introduces students to the Swift programming language in a user-friendly and engaging way. The platform enables students to seamlessly transition from learning the basics to designing and programming their apps. Swift Playgrounds serves as a dynamic and supportive space for students to explore their creativity and build essential programming skills.
Requires
- downloaded App (requires Apple device)
- internet access
- computers, laptops or tablets
Enables students to:
- extend programming knowledge and understanding
- implement algorithms as visual programs
- build simple app designs
- write a visual program with branching and iteration
- use control structures within visual programs

Further reading and professional learning
-
What is visual programming?
Find out more -
Learn to program with Scratch
Find out more -
Make an App in Swift Playgrounds
Find out more

Years 5–6 What is visual programming?
Resources and information for teachers about visual programming.
Suggested time
30 minutes
Years 5–6 Learn to program with Scratch
This document provides essential information for beginners getting started with Scratch programming.
Suggested time
30 minutes
Years 5–6 Make an App in Swift Playgrounds
This video tutorial (6.5 min) gives the basics for developing an app using Swift Playgrounds.
Suggested time
7 minutes
Evaluating
What is it about?
Students are guided to evaluate solutions against specific design criteria and user stories. They assess how their solutions might affect or benefit the community at large. Design criteria are the predetermined standards or specifications that a solution must meet, ensuring its effectiveness and functionality. User stories give insights into the end users' needs, preferences and interactions with the solution. The process of evaluation helps students develop critical thinking skills, which help them ensure that their solutions align with established criteria, meet user requirements, and contribute positively to the wider community.
Content description
Evaluate existing and student solutions against the design criteria and user stories and their broader community impact AC9TDI6P06
This sequence enables students to:
- understand effective testing and evaluation of app prototypes for usability and user experience
- grasp the significance of the test phase in the design thinking process
- systematically capture and analyse feedback
- gather valuable feedback on effectiveness of solutions within projects
- share results and insights of app designs with a broader audience
- gain insights to refine and optimise user interfaces in line with design principles and design criteria.
Resources to include
Resources to introduce
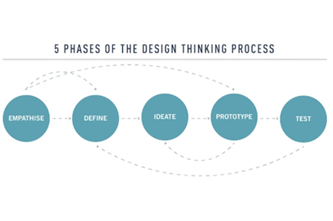

Years 5–6 User testing
This website offers students valuable insights into user testing methods in the realm of UX design. It delves into the essential question of how to effectively test prototypes and introduces five prominent user testing techniques commonly employed by UX designers and design thinkers.
Requires
- internet access
Suggested time
30 minutesEnables students to:
- gain insights into common user testing methods within the design thinking framework
- understand how to effectively test and evaluate app prototypes for usability and UX.
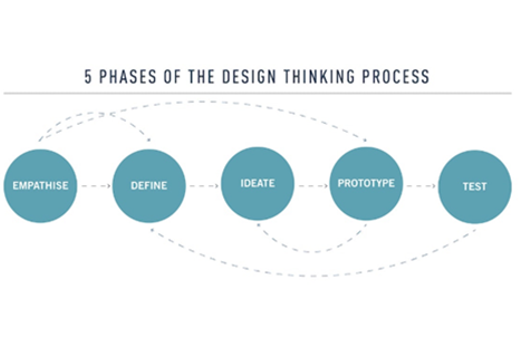
Years 5–6 Design thinking: test
Use this video to support students in their understanding of the test phase as part of the design thinking process.
Requires
- internet access
- teacher laptop and interactive whiteboard to view video as a class
Suggested time
5 minutesEnables students to:
- understand the test phase as part of the design thinking process.
Resources to develop and consolidate learning
-
Feedback capture grid
Find out more -
Ladder of Feedback
Find out more -
Solution Interview
Find out more

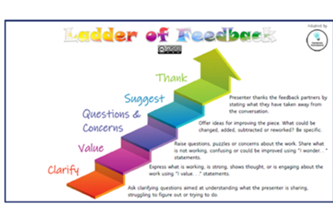

Years 5–6 Feedback capture grid
This tool helps students in testing ideas using prototypes. It provides a simple way to document test results. The tool is particularly valuable in assessing how effectively an idea addresses a previously identified user problem.
Requires
- printed worksheet
Suggested time
45 minutesEnables students to:
- document and organise test results for app prototypes in a simplified format
- assess app ideas
- systematically capture and analyse feedback.
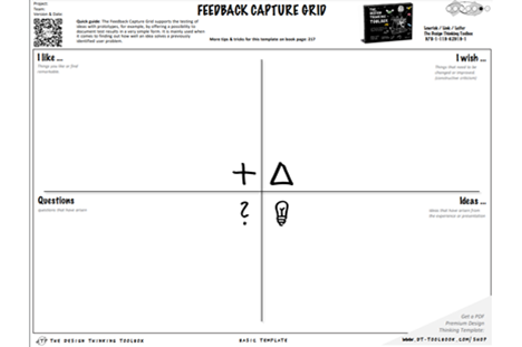
Years 5–6 Ladder of Feedback
The Ladder of Feedback routine is a valuable tool for students seeking peer feedback on their app designs. It facilitates a structured approach to the feedback process by offering opportunities for clarity, identification of strengths and weaknesses, constructive exploration of concerns, and suggestions for improvement.
Requires
- internet access
- teacher laptop and interactive whiteboard to view resource as a class
Suggested time
45 minutesEnables students to:
- clarify their understanding of peers' perspectives on their app designs
- identify and appreciate the positives and strengths in their app development work
- engage in constructive exploration of weaknesses and areas of concern, while actively seeking and providing suggestions for improvement in a positive learning environment.
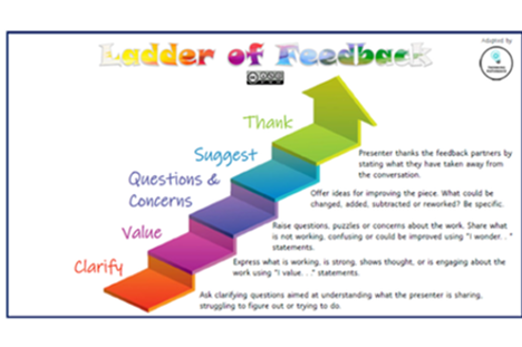
Years 5–6 Solution Interview
Use this template to support students in testing their app designs, especially when working with prototypes. The main aim is to assess the viability and acceptance of the solutions developed within the project by the targeted users. On completion of the interview analysis, students can refine and optimise their app designs.
Requires
- printed worksheet
Suggested time
45 minutesEnables students to:
- plan and conduct structured interviews to test their prototypes
- gather feedback on the acceptance and effectiveness of their solutions
- gain real-world insights into user perspectives, preferences and potential challenges.
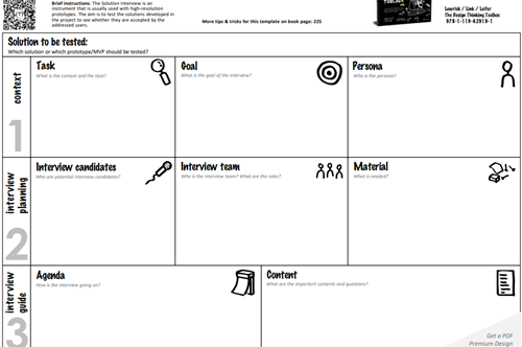
Resources to apply and extend learning
-
Create a pitch
Find out more -
App Showcase Guide
Find out more -
Ten usability heuristics
Find out more -
Sample usability heuristic questions
Find out more
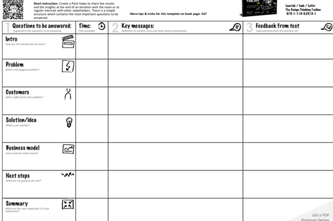


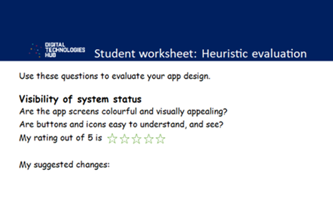
Years 5–6 Create a pitch
This template aids students in sharing the results and insights of their app designs at the end of an iteration or during regular intervals with users. It provides a simple and structured format, guiding students to address the most important questions related to their app development projects.
Requires
- printed worksheet
Suggested time
1 hourEnables students to:
- effectively share the results and insights of their app designs
- address key questions about their app development projects
- discuss feedback received during pitch sessions and make refinements to their app.
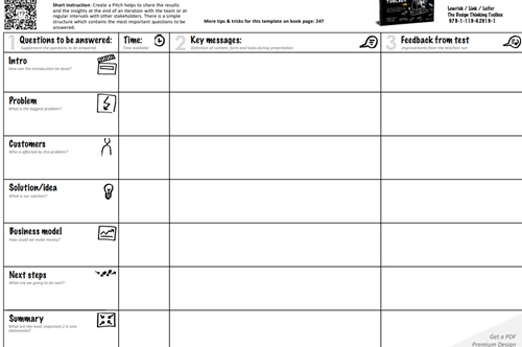
Years 5–6 App Showcase Guide
This Apple platform supports students in testing their app designs by providing a celebratory and collaborative environment that encourages them to make iterative improvements in their app designs, and gives them opportunity to showcase their problem-solving and coding skills. The guide offers resources and information to help teachers plan and prepare for a showcase event. It includes details on showcase formats, tips for inviting and preparing judges, and downloadable rubrics and certificates.
Requires
- judges
- printed certificates
Enables students to:
- present and pitch their app designs to a panel of judges
- celebrate their ingenuity and share their solutions with peers, families and the community
- receive recognition and feedback during the showcase event.

Years 5–6 Ten usability heuristics
This resource lists ten general principles for interaction design. They are called ‘heuristics’ because they are broad rules of thumb and not specific usability guidelines.
Requires
- printed or digitally displayed infographic
Suggested time
30 minutesEnables students to:
- systematically assess their app designs and evaluate the effectiveness of various design elements
- identify potential issues related to UX, navigation and overall usability within their app designs
- gain insights that enable them to refine and optimise user interfaces in line with design principles.
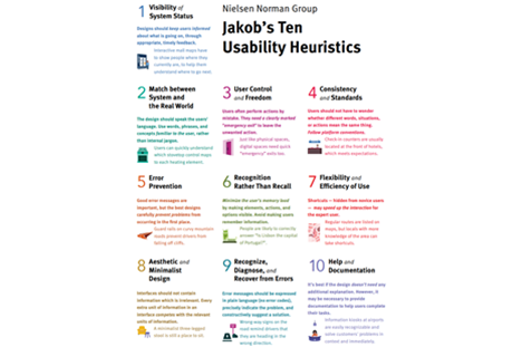
Years 5–6 Sample usability heuristic questions
This resource lists ten general principles for interaction design along with two app design example questions for each principle.
Requires
- printed or digitally displayed document
Suggested time
30 minutesEnables students to:
- systematically assess their app designs and evaluate the effectiveness of various design elements
- identify potential issues related to UX, navigation and overall usability within their app designs
- gain insights that enable them to refine and optimise user interfaces in line with design principles.
Further reading and professional learning

Years 5–6 10 usability heuristics for user interface design
Learn more about Jakob Nielsen's ten general principles for interaction design.
Suggested time
30 minutes