Scope and sequence (F–10)
Learning programs to support implementation
Sequenced topics that could be used in teaching the Australian Curriculum Digital Technologies curriculum to address the content descriptions of the curriculum. The Scope and sequence has been updated to support teachers to implement AC:DT V9.0.
Select a topic across a two year cycle
Recommended any combination of three topics per year.
Choose a combination of units that suits your students and context.
Cycle one (Year 1)
Cycle two (Year 2)
Cycle one (Year 1)
| Jan | Jun | Dec | |||||||||
|---|---|---|---|---|---|---|---|---|---|---|---|
Cycle two (Year 2)
| Jan | Jun | Dec | |||||||||
|---|---|---|---|---|---|---|---|---|---|---|---|
Using digital systems safely
Overview
This unit introduces students to common digital systems and builds an understanding of the role hardware and software play in transmitting data. Students are guided to use applications as they use digital systems for a purpose. They also learn about how to practice being safe users of digital systems.
Achievement standards
By the end of Year 2, with assistance, students access and use digital systems for a purpose. They use the basic features of common digital tools to create, locate and share content, and to collaborate, following agreed behaviours. Students recognise that digital tools may store their personal data online.
Australian Curriculum
Content descriptions
Digital systems AC9TDI2K01
Privacy and security AC9TDI2P06, AC9TDI2P07
Evaluating AC9TDI2P03
Related content and General capabilities
Digital Literacy: Practising digital safety and wellbeing, Managing and operating
This topic enables students to
- describe examples of hardware and software used in digital systems
- use some common digital systems for a particular purpose
- identify ways to stay safe when using digital systems.
Watch this video for a quick overview of the unit and how to use its resources with your students.
Assessment View assessment advice
Achievement standard
By the end of Year 2, with assistance, students access and use digital systems for a purpose. They use the basic features of common digital tools to create, locate and share content, and to collaborate, following agreed behaviours. Students recognise that digital tools may store their personal data online.
Assessment tasks
Use the work sample and associated task, WS01 – Organising ideas: My school, to assess students’ understanding and knowledge about digital systems.
Rubric: Common digital systems
| Knowledge of common digital systems | has a limited understanding of common digital systems | shows understanding of common digital systems and describes one digital system and its purpose | shows understanding of common digital systems and their purpose, and can identify features and some hardware and software | shows understanding of common digital systems and identifies their features, purpose and the role of hardware and software |
| Demonstrates use of common digital systems | has limited capacity to demonstrate the use of a common digital system | demonstrates the use of a common digital system and can partly describe its purpose | demonstrates the use of at least one common digital system and can clearly describe its purpose | selects a digital system for a given purpose, demonstrates its use and justifies their choice |
| Creates a model of common digital systems | the model has minimal resemblance to a common digital system | the model has recognisable features of a common digital system | the model has clearly recognisable features of a common digital system | the model has clearly recognisable features of a common digital system and the student explains the different parts |
Rubric: Personal information
| Knowledge of personal information | has a limited understanding of personal information | shows understanding of personal information and gives some examples of data that is personal | shows understanding of personal information, gives some examples of data that is personal and explains why it is important to protect this information and keep it safe | shows understanding of personal information, gives examples of data that is personal and explains why it is important to protect this information and keep it safe. They identify where personal data could be made visible when using digital systems |
| Uses digital systems, keeping their personal information safe | uses digital systems but needs to be reminded to keep their personal information safe | uses digital systems and describes some ways to keep their personal information safe | uses digital systems and describes ways to keep their personal information safe | uses digital systems safely and describes relevant strategies – including the importance of a trusted adult – to keep their personal information safe when asked to give their personal information |
Unit sequence
This topic offers 3 sequential units
Unit 1
Common digital systems we use
Students explore common digital systems such as a computer, tablet, laptop and smartphone.Unit 2
Using digital systems for a purpose
Students explore using digital systems for a purpose.Unit 3
Safe use of digital systems
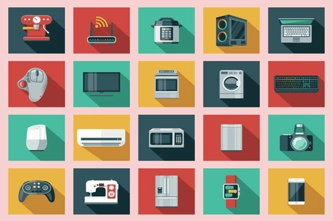
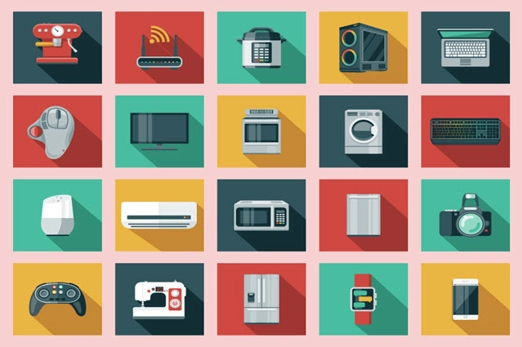
Students identify ways to stay safe when using digital systems and learn about how to keep their personal information safe.Common digital systems we use
What is this about?
A computer is a common digital system. Tablets, laptops and smartphones are also digital systems.
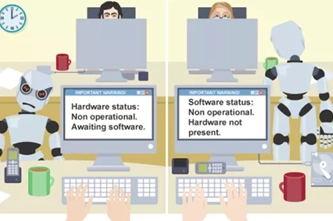
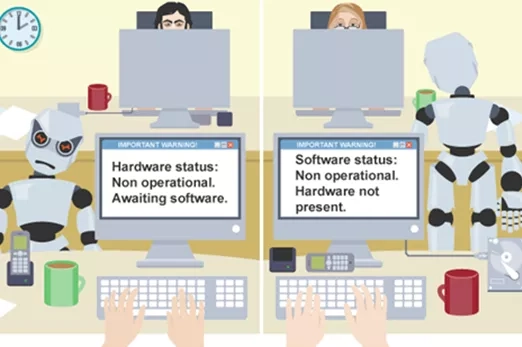
The digital system uses a hardware and software component to enable a user to complete specific tasks.
Hardware refers to the physical parts of the computer, which you can touch. A desktop computer includes the case (or tower), monitor, keyboard and mouse. The software refers to the applications that make the computer work and tell it what to do. These might include word processing and presentation software, a drawing program, photo editing, video playing and other applications.
Content description
Identify and explore digital systems and their components for a purpose AC9TDI2K01
This sequence enables students to:
- identify some common digital systems
- describe a common digital system and its particular purpose
- describe examples of hardware and software.
Resources to include
Resources to introduce
-

Digital systems: What are they?
Find out more -
Basic parts of a computer
Find out more -
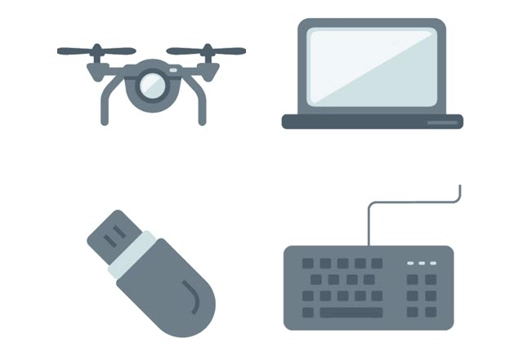
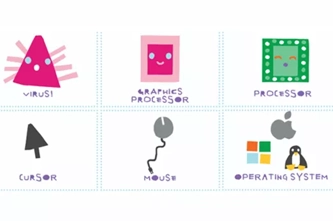
Digital systems cards
Find out more -
Do computers have a memory?
Find out more


Years 1–2 Digital systems: What are they?
Use these slides to discuss hardware, software and peripheral devices (for example, printers).
Requires
- internet access
- computer and interactive whiteboard to display slides
Suggested time
30 minutesEnables students to:
- identify some common digital systems
- describe a common digital system and its particular purpose.

Years 1–2 Basic parts of a computer
Use this tutorial to explain the basic parts of a computer and the important role they play.
Requires
- internet access
- computer and interactive whiteboard to display website
Suggested time
30 minutesEnables students to:
- identify some common digital systems
- describe a common digital system and its particular purpose.
Years 1–2 Digital systems cards
Use the cards (symbols only) to support building knowledge and understanding of digital systems with a focus on the components of digital systems; in particular, hardware and peripheral devices.
Requires
- one set of printed cards per student
Suggested time
30 minutesEnables students to:
- identify some common digital systems
- describe a common digital system and its particular purpose.
Years 1–2 Do computers have a memory?
Use this resource to discuss how computer memory helps us save and store information.
Requires
- internet access
- computer and interactive whiteboard to display website
Suggested time
1 hourEnables students to:
- identify some common digital systems
- describe a common digital system and its particular purpose
- describe ways to save files.
Resources to develop and consolidate learning

Years 1–2 (Computer) memory game
Use this memory game to learn the different components of a computer and what they do.
Requires
- one set of printed game cards per small group of students
Suggested time
30 minutesEnables students to:
- identify some common digital systems
- describe a common digital system and its particular purpose.

Years 1–2 Software
Use this guide to explain about hardware (the physical parts of the computer) and software (the programs that run on a computer).
Requires
- internet access
- computer and interactive whiteboard to display website
Suggested time
30 minutesEnables students to:
- identify some common digital systems
- describe a common digital system and its particular purpose
- identify software and what it can be used for.
Years 1–2 Clever computers
Use this sequence of lessons to help students understand the elements of a digital system, including hardware, software and some commonly used peripheral devices. Investigate how these elements work together.
Requires
- internet access
- computer and interactive whiteboard to display slides
Suggested time
1 hourEnables students to:
- describe examples of hardware and software
- identify software and what it can be used for.

Resources to extend and integrate learning
-
We're going on a computer hunt
Find out more -
How can computers be connected?
Find out more -
How computers have changed
Find out more -
Questions we have about the internet
Find out more
Years 1–2 We're going on a computer hunt
This is a take-home activity to be completed as a family task.
Requires
- one set of printed worksheets per student
Suggested time
30 minutesEnables students to:
- describe examples of hardware and software
- identify software and what it can be used for.
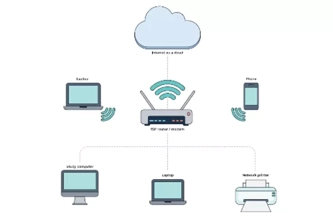
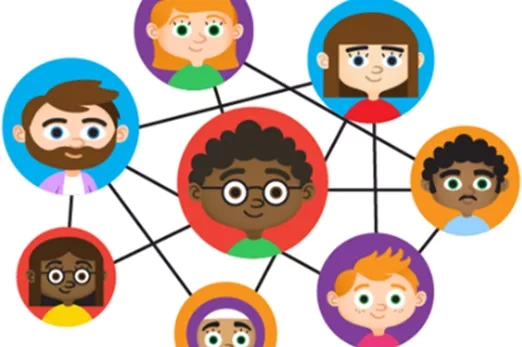
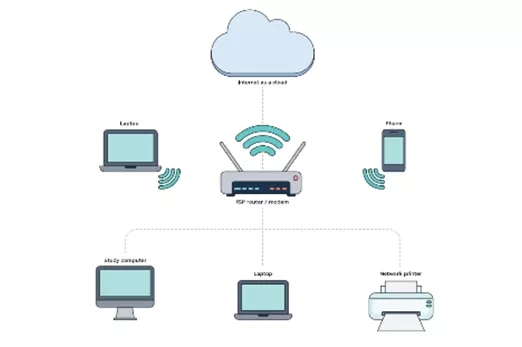
Years 1–2 How can computers be connected?
Use this resource to explain in simple terms how computers are connected to share information.
Requires
- internet access
- computer and interactive whiteboard to display slides
Suggested time
30 minutesEnables students to:
- identify some common digital systems
- describe a common digital system and its particular purpose.
Years 1–2 How computers have changed
Use this resource to discuss ways computer technology has changed over time.
Requires
- internet access
- computer and interactive whiteboard to display slides
Suggested time
30 minutesEnables students to:
- identify some common digital systems
- describe a common digital system and its particular purpose.
Years 1–2 Questions we have about the internet
Use this resource to introduce internet safety when discussing networked computers and using the internet.
Requires
- internet access
- computer
- printed worksheets
- a space to display ideas
Suggested time
1 hourEnables students to:
- identify some common digital systems
- describe ways to stay safe online.
Further reading and professional learning
What is a digital system and how do digital systems help us?
Use this resource for guidance to include digital systems in your teaching program.
Suggested time
30 minutes
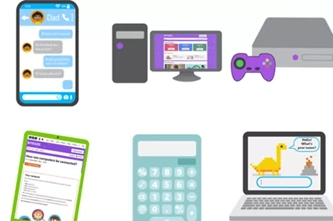
Using digital systems for a purpose
What is this about?
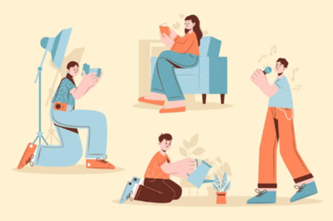
A computer is a common digital system. Tablets, laptops and smartphones are also digital systems. At this level, students develop their understanding of digital systems (hardware and software) when they use some key functions to undertake authentic learning tasks. A modelled approach supports students to understand how to match familiar forms of software and hardware with their purpose. This might include typing a short story using word processing, retelling a story in a sequence using presentation software, creating an avatar using a drawing program, taking photographs and using photo editing software, or recording a video of them explaining their learning using a tablet with a camera.
Content descriptions
Identify and explore digital systems and their components for a purpose AC9TDI2K01
Discuss how existing digital systems satisfy identified needs for known users AC9TDI2P03
This sequence enables students to:
- identify some common digital systems
- describe a common digital system and its particular purpose
- describe examples of hardware and software
- recognise data represented as images of common digital systems.
Resources to include
Resources to introduce
-
Using a computer to write
Find out more -
How can you make digital art
Find out more -
What are digital photos and videos?
Find out more


Years 1–2 Using a computer to write
Use this resource to discuss how computers help us write.
Requires
- internet access
- computer and interactive whiteboard to display website
Suggested time
1 hourEnables students to:
- identify some common digital systems
- describe a common digital system and its particular purpose.
Years 1–2 How can you make digital art
Use this resource to discuss how computers help us to create digital art.
Requires
- internet access
- computer and interactive whiteboard to display website
Suggested time
30 minutesEnables students to:
- identify some common digital systems
- describe a common digital system and its particular purpose.

Years 1–2 What are digital photos and videos?
Use this resource to discuss how we use devices with cameras to take digital photographs and video.
Requires
- internet access
- computer and interactive whiteboard to display website
Suggested time
30 minutesEnables students to:
- identify some common digital systems
- describe a common digital system and its particular purpose.

Resources to develop and consolidate learning
Years 1–2 How can we make digital pictures move?
Use this resource to discuss how computers help us to create simple animations.
Requires
- internet access
- computer and interactive whiteboard to display website
Suggested time
30 minutesEnables students to:
- identify some common digital systems
- describe a common digital system and its particular purpose.
Years 1–2 How do we communicate online?
Use this resource to discuss how we communicate online.
Requires
- internet access
- computer and interactive whiteboard to display website
Suggested time
30 minutesEnables students to:
- identify some common digital systems
- describe a common digital system and its particular purpose.
Resources to extend and integrate learning
-
What is the internet?
Find out more -
Finding things on the web
Find out more -
How can we trust a website?
Find out more


Years 1–2 What is the internet?
Use this resource to explain that the internet is a very big network of computers from all around the world. Note this resource contains a video that is not accessible in our region.
Requires
- internet access
- computer and interactive whiteboard to display website
Suggested time
30 minutesEnables students to:
- identify some common digital systems
- describe a common digital system and its particular purpose.

Years 1–2 Finding things on the web
Use this resource to explain how we use the internet to find information online.
Requires
- internet access
- computer and interactive whiteboard to display website
Suggested time
30 minutesEnables students to:
- identify some common digital systems
- describe a common digital system and its particular purpose.
Years 1–2 How can we trust a website?
Use this resource to explain that sometimes a website might have information on it that is not true and has mistakes.
Requires
- internet access
- computer and interactive whiteboard to display website
Suggested time
30 minutesEnables students to:
- students evaluate websites to describe ways these can be trusted.

Safe use of digital systems
What is this about?
It is important when accessing and sharing information online that students are aware of potential dangers and that they behave in a responsible manner. As an extension of classroom rules, discuss rules for online safety and acceptable online behaviour. There are many situations, connected to the internet, in which people are asked for their personal information. Personal information can be used to identify a particular person and care must be taken when providing this information. It is potentially dangerous for strangers to have your personal information. Young children must check with a trusted adult before sharing any personal information online.
Content descriptions
Access their school account with a recorded username and password AC9TDI2P06
Discuss that some websites and apps store their personal data online AC9TDI2P07
This sequence enables students to:
- identify some common digital systems
- describe a common digital system and its particular purpose
- identify ways to stay safe when using digital systems
- describe their personal information (data that is personal and owned by them)
- identify who they would ask for help with being safe online.
Resources to include
Resources to introduce
Years 1–2 Under lock and key
Use this resource to help students understand what personal information is, and why it’s important to protect it.
Requires
- one printed worksheet per student
Suggested time
30 minutesEnables students to:
- describe their personal information
- describe ways to keep their personal information safe.
Years 1–2 Digital citizenship
This lesson helps students learn to think critically about the user information that some websites request or require. Students learn the difference between private information and personal information, distinguishing what is safe and unsafe to share online.
Requires
- one printed worksheet per student
Suggested time
30 minutesEnables students to:
- describe their personal information
- describe ways to keep their personal information safe.
Resources to develop and consolidate learning


Years 1–2 Communicating safely online
This sequence explores the nature of personal information, how data can be recorded to reflect individual identity, and how students can protect their personal information.
Requires
- internet access
- computer and interactive whiteboard to display slide presentation
Suggested time
1 hourEnables students to:
- identify some common digital systems
- describe their personal information
- identify who they would ask for help with being safe online.

Years 1–2 Ask for help
This activity helps students recognise an unsafe situation when using digital systems, and explore help-seeking strategies.
Requires
- internet access
- computer and interactive whiteboard to display slide presentation
Suggested time
1 hourEnables students to:
- identify some common digital systems
- describe their personal information
- identify who they would ask for help with being safe online.

Resources to extend and integrate learning

Years 1–2 Mighty Heroes student page
Use these brief videos to learn how to be safer online.
Requires
- internet access
- computer and interactive whiteboard to display videos
Suggested time
1 hourEnables students to:
- identify some common digital systems
- describe a common digital system and its particular purpose
- identify software and what it can be used for.
Years 1–2 Digital citizenship: Online safety
This lesson helps students learn about the similarities of staying safe in the real world and when visiting websites. Students will also learn that the information they put online leaves a digital footprint or ‘trail’.
Requires
- internet access
- computer and interactive whiteboard to display video
- printed materials
Suggested time
1 hourEnables students to:
- describe their personal information (data that is personal and owned by them)
- describe ways to protect their personal information.
Further reading and professional learning

Years 1–2 Online safety – Year 2
This ACARA Curriculum connection has advice about teacher online safety.
Suggested time
30 minutes
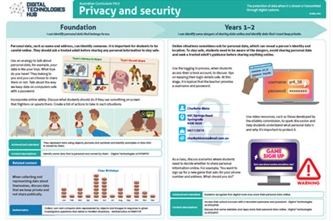
Years 1–2 Privacy and security infographic (F-10)
Explore privacy and security for your Year band.
Suggested time
30 mins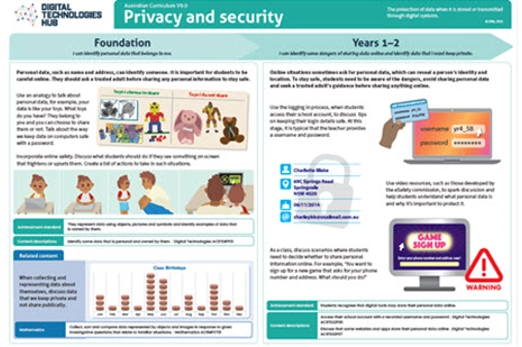
Solving simple problems
Overview
This unit provides opportunities to explore algorithms, conceptualising algorithms as a sequence of steps or procedures for carrying out instructions to solve problems. It also incorporates representing data as part of our algorithms.
Achievement standards
By the end of Year 2 students show how simple digital solutions meet a need for known users. Students represent and process data in different ways. They follow and describe basic algorithms involving a sequence of steps and branching.
Australian Curriculum
Content descriptions
Investigating and defining AC9TDI2P01
Generating and designing AC9TDI2P02
Representing data AC9TDI2K02
Related content and General capabilities
Digital Literacy: Practising digital safety and wellbeing, Managing and operating
This topic enables students to
- identify familiar activities that can be described as a series of steps
- describe and represent familiar activities as an algorithm
- order steps such as instructions in a correct sequence
- follow and create an algorithm to perform a series of instructions/steps
- describe the parts of the algorithm that include branching and iteration.
Watch this video for a quick overview of the unit and how to use its resources with your students.
Assessment View assessment advice
Achievement standard
By the end of Year 2 students show how simple digital solutions meet a need for known users. Students represent and process data in different ways. They follow and describe basic algorithms involving a sequence of steps and branching.
Assessment tasks
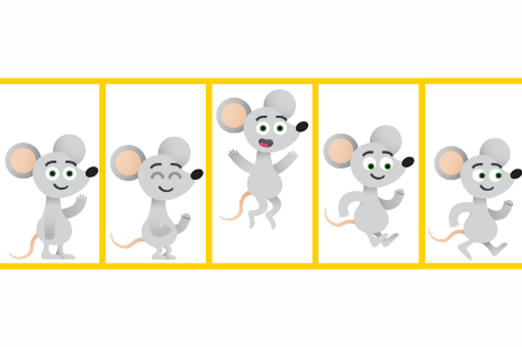
Use the assessment task Fairytale fun, where students use the slide sorter function to arrange a set of presentation slides in correct sequence to retell a fairytale. Alternatively, provide the images for students to sequence as an unplugged task.
Use the two multiple choice questions Planting a seed and Brushing your teeth to assess students’ understanding of sequencing steps and identifying a missing step. Alternatively, provide the assessment tasks for students to complete unplugged using this worksheet.
Rubric: Algorithms
| Following algorithms (following verbal, written or drawn instructions) | with guidance can follow a simple sequence of steps | can follow a sequence of steps | can follow a sequence of steps with decisions (branching) and repeated steps (iteration) | can follow a sequence of steps with decisions (branching) and repeated steps (iteration), explaining the purpose of each step in achieving the overall outcome |
| Describing algorithms (describing an algorithm represented verbally, or as written or drawn instructions) | with guidance can describe a simple sequence of steps | can describe a sequence of steps | can describe a sequence of steps with decisions (branching) and repeated steps (iteration) | can describe a sequence of steps with decisions (branching) and repeated steps (iteration), explaining the purpose of each step in achieving the overall outcome. Can explain reasons for their choice of representation |
Rubric: Representing data
| Representing data in algorithms (following and describing verbal, written or drawn instructions) | with guidance identifies the type of data to describe a simple sequence of steps | identifies the type of data to describe a sequence of steps | identifies and selects the type of data to describe a sequence of steps | identifies and selects the type of data to describe a sequence of steps and justifies their choice of data |
Unit sequence
This topic offers 3 sequential units
Unit 1
An intro to algorithms
Provide opportunities to explore algorithms, conceptualising algorithms as a sequence of steps or procedures for carrying out instructions to solve problems.Unit 2
Instructing a floor robot
Use programming floor robots as an authentic means to use algorithms, emphasising concepts like positional language, sequencing and estimation.Unit 3
Algorithms with branching and iteration
Introduce algorithms that involve making a decision (branching) and repeat steps (iteration).An intro to algorithms
What is this about?
Provide opportunities to explore algorithms through guided play, including hands-on, kinaesthetic and interactive learning experiences. Students begin to develop their design skills by conceptualising algorithms as a sequence of steps or procedures for carrying out instructions to solve problems or achieve certain things. These skills could include identifying steps in a familiar process such as brushing their teeth or instructions to complete a task. It also provides an opportunity to explore a story by an Aboriginal or Torres Strait Islander author that has a sequence that can be followed.
Content descriptions
Investigate simple problems for known users that can be solved with digital systems AC9TDI2P01
Follow and describe algorithms involving a sequence of steps, branching (decisions) and iteration (repetition) AC9TDI2P02
Represent data as pictures, symbols, numbers and words AC9TDI2K02
This sequence enables students to:
- identify familiar activities that can be described as a series of steps
- describe familiar activities as an algorithm
- order steps such as instructions in a correct sequence
- follow and create an algorithm to perform a series of instructions/steps.
Resources to include
Resources to introduce
-
What is an algorithm
Find out more -
7 ways you’re using algorithms in your daily life without even knowing
Find out more -
Sequencing | Lesson 3 | Camp Coding Camp
Find out more


Years 1–2 What is an algorithm
Use this resource to discuss what an algorithm is and use the examples to explore relevant ideas.
Requires
- internet access
- computer and interactive whiteboard to display website Note: the video may not play in your region, however the transcript demonstrates the coverage of the video.
Suggested time
30 minutesEnables students to:
- identify familiar activities that can be described as a series of steps
- describe familiar activities as an algorithm.
Years 1–2 7 ways you’re using algorithms in your daily life without even knowing
Use these examples to explore familiar activities that can be described using a series of steps.
Requires
- internet access
- computer and interactive whiteboard to display website
Suggested time
30 minutesEnables students to:
- identify familiar activities that can be described as a series of steps
- describe familiar activities as an algorithm.

Years 1–2 Sequencing | Lesson 3 | Camp Coding Camp
Watch this fun video to explain the algorithm as a sequence of steps that a computer can follow.
Requires
- internet access
- computer and interactive whiteboard to display video
Suggested time
4 minutesEnables students to:
- identify familiar activities that can be described as a series of steps
- describe familiar activities as an algorithm.
Resources to develop and consolidate learning
-
Introducing algorithms
Find out more -
Algorithms – Storytelling sequence
Find out more -
Follow the algorithm
Find out more -
About me
Find out more


Years 1–2 Introducing algorithms
In this sequence of lessons, students design a sequence of steps for others to follow. They convey their instructions to peers and evaluate the work of others to determine if the outcome was successful.
Requires
- printed worksheet with 4 × 4 grids
Suggested time
1 hourEnables students to:
- order instructions in a correct sequence.
Years 1–2 Algorithms – Storytelling sequence
In this lesson, students will explore a story by an Aboriginal or Torres Strait Islander author that has a sequence that can be followed. Students will sequence the main elements or steps in the story in their own way and share with peers.
Requires
- printed worksheet
- Book: On the Way to Nana’s by Frances and Lindsay Haji Ali
Suggested time
1 hourEnables students to:
- order images of a story in a correct sequence.
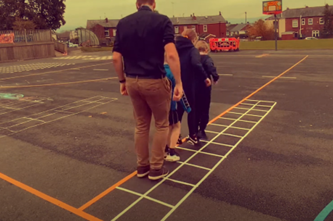
Years 1–2 Follow the algorithm
In this context-setting lesson, students will play a game intended to get them thinking about sequential instructions.
Requires
- a large area to practice following algorithms that involve movement
Suggested time
1 hourEnables students to:
- describe some basic moves
- follow and create an algorithm to perform a series of movements.
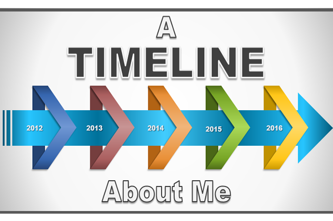
Years 1–2 About me
Order images to show a sequence of personal events or milestones such as birth, first tooth and beginning to crawl.
Requires
- computer and slide presentation software
- image creation software or drawn images photographed and uploaded to presentation software
Suggested time
1 hourEnables students to:
- identify key stages in their life as a timeline
- order a series of images in a correct sequence.

Resources to apply and extend learning
-
Dancing to teach coding and algorithms
Find out more -
First to finish
Find out more -
The smiley face biscuit challenge
Find out more


Years 1–2 Dancing to teach coding and algorithms
View this video for ideas to integrate simple dance moves as a sequence of steps.
Requires
- internet access
- computer
- large grids outside marked with chalk to practise dance moves
Suggested time
1 hourEnables students to:
- describe some basic dance moves
- follow and create an algorithm to perform a series of dance moves.

Years 1–2 First to finish
Use this lesson to compare algorithms designed to complete the same task, and evaluate each for efficiency.
Requires
- internet access
- computer and interactive whiteboard to display slides
Suggested time
1 hourEnables students to:
- repeat a task to develop more efficient processes
- write down the steps they followed to complete their task.

Years 1–2 The smiley face biscuit challenge
Use the lesson in this resource to order a set of cards to create a smiley face biscuit.
Requires
- one printed worksheet with images per student or group
- scissors
Suggested time
1 hourEnables students to:
- order instructions in a correct sequence.

Background and professional learning
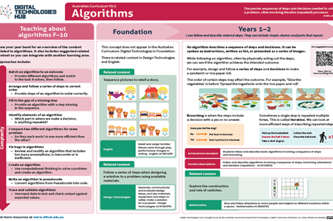
Years 1–2 Algorithms
Download this A3 poster for planning sessions and use it to view the coverage of algorithms for Years 1–2.
Suggested time
30 minutes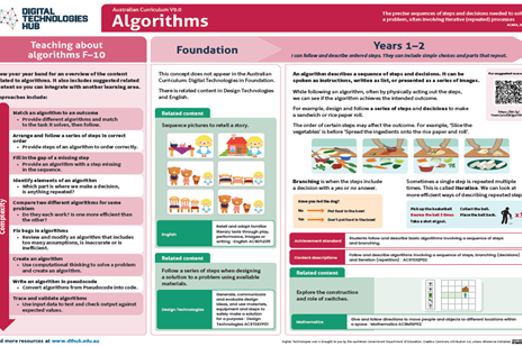
Instructing a floor robot
What is this about?
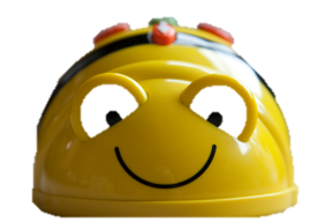
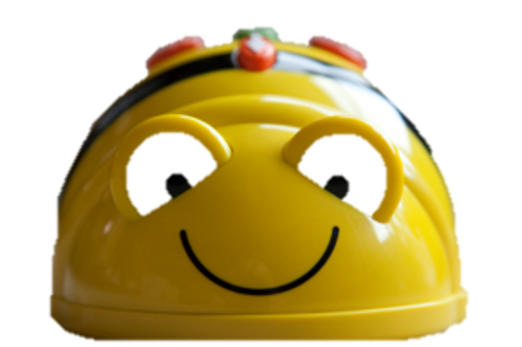
Use programming floor robots as an authentic way to introduce students to basic programming principles, emphasising concepts like positional language, sequencing and estimation. The goal is to foster foundational skills in computational thinking and enhance awareness of digital systems through firsthand experiences. Explore algorithms through guided play and interactive learning, allowing students to conceptualise algorithms as step-by-step procedures to solve problems or control devices like Bee-Bots. While there's no specific programming language requirement for Years 1–2 students, they can begin developing basic programming skills, focusing on designing sequences of steps, such as programming a robotic toy's movement.
Content descriptions
Investigate simple problems for known users that can be solved with digital systems AC9TDI2P01
Follow and describe algorithms involving a sequence of steps, branching (decisions) and iteration (repetition) AC9TDI2P02
Represent data as pictures, symbols, numbers and words AC9TDI2K02
This sequence enables students to:
- order instructions in a correct sequence
- use arrows to describe directional movement
- use a grid and arrows to represent an algorithm.
Resources to include
Resources to introduce
-
How do you program a robot?
Find out more -
Programming people
Find out more -
Using your flat wom-bot
Find out more


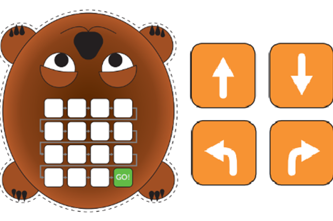
Years 1–2 How do you program a robot?
Use this resource to set the task of giving a robot instruction to move.
Requires
- internet access
- computer and interactive whiteboard to display website
Suggested time
30 minutesEnables students to:
- order instructions in a correct sequence
- use arrows as a form of representation to describe directional movement.
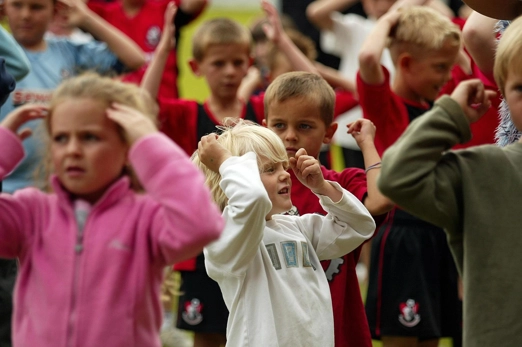
Years 1–2 Programming people
Play a variation of the game ‘Simon says’ to develop understanding of sequencing and instructions in programming.
Requires
- one set of printed programming cards per group of students
Suggested time
30 minutesEnables students to:
- order instructions in a correct sequence
- use arrows as a form of representation to describe directional movement.
Years 1–2 Using your flat wom-bot
Use this resource to discuss how to use arrows to program a floor robot.
Requires
- one printed sheet per student
- use arrows as a form of representation to describe directional movement.
Suggested time
30 minutesEnables students to:
- order instructions in a correct sequence

Resources to develop and consolidate learning
-
Buzzing with Bee-Bots
Find out more -
Goldilocks, the three bears and Bee-Bot
Find out more -
Bee-Bot ruler
Find out more

Years 1–2 Buzzing with Bee-Bots
In this lesson, students follow and describe a series of steps to program a floor robot.
Requires
- class set of Bee-Bots
Suggested time
1 hourEnables students to:
- order instructions in a correct sequence
- use arrows as a form of representation to describe directional movement.

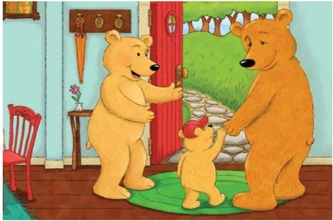
Years 1–2 Goldilocks, the three bears and Bee-Bot
Students explore a sequence of steps using Bee-Bots in the context of familiar narratives. They navigate a Bee-Bot to events within the story, first as a whole class and then in small groups.
Requires
- class set of Bee-bots
Suggested time
1 hourEnables students to:
- order instructions in a correct sequence
- use arrows as a form of representation to describe directional movement.

Years 1–2 Bee-Bot ruler
Explore the concept of sequencing steps, using Bee-Bots to measure length.
Requires
- class set of Bee-Bots
Suggested time
1 hourEnables students to:
- order instructions in a correct sequence
- estimate length
- use arrows as a form of representation to describe directional movement.
Resources to apply and extend learning
-
Spelling bee
Find out more -
Skip-counting with Bee-Bots
Find out more -
Blue-Bot challenges
Find out more
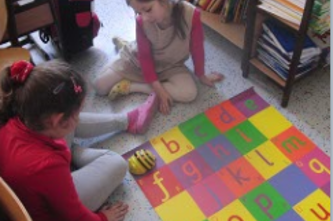

Years 1–2 Spelling bee
Write a set of instructions that program a Bee-Bot to move to letters to spell out a word on an alphabet grid.
Requires
- internet access
- computer and interactive whiteboard to display website
Suggested time
30 minutesEnables students to:
- order instructions in a correct sequence
- use arrows as a form of representation to describe directional movement
- use a grid to represent an algorithm.

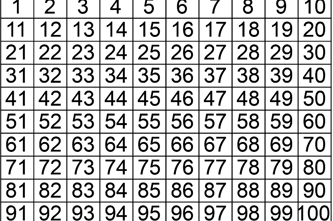
Years 1–2 Skip-counting with Bee-Bots
Play a skip-counting game where students program a Bee-Bot to stop at multiples of a set number, e.g. 2, 4, 5, 10, on a number grid.
Requires
- class set of Bee-Bots
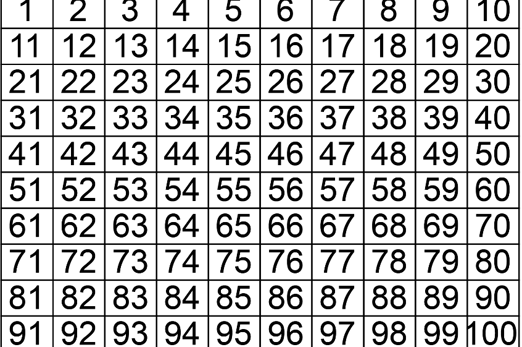
- large 100 chart as a grid for Bee-Bot to move from number to number.
Suggested time
1 hourEnables students to:
- order instructions in a correct sequence
- use arrows as a form of representation to describe directional movement
- use a grid to represent an algorithm.
Years 1–2 Blue-Bot challenges
Use these challenges created by Kylie Docherty, QSITE to provide opportunities for students to learn how to design and follow a series of steps to program Blue-Bot or use a Bee-Bot.
Requires
- one printed worksheet per student
- class set of blue-bots or Bee-Bots
Suggested time
30 minutesEnables students to:
- order instructions in a correct sequence
- use arrows to describe directional movement.
Algorithms with branching and iteration
What is this about?
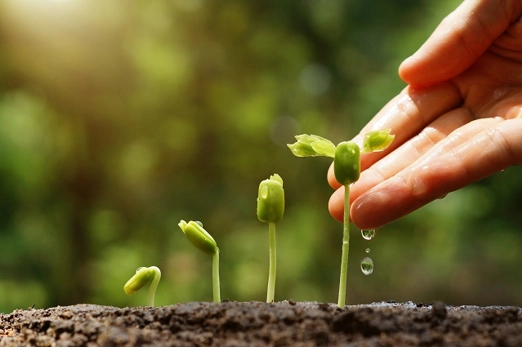
Delve further into the concept of algorithms by examining and representing the decisions and steps involved in everyday processes. For instance, planting seeds to grow seedlings, with each step becoming a part of the algorithm, like building blocks to form a sequence. The goal is to connect the abstract idea of algorithms to tangible, relatable events in the students' lives. By using examples such as solving puzzles, creating instructions to play a traditional Australian First Nations game, building models with snap blocks, or nurturing seedlings, students can grasp the notion of algorithms as step-by-step instructions, similar to a recipe for accomplishing tasks. Introduce algorithms that involve making a decision (branching) and repeat steps (iteration).
Content descriptions
Investigate simple problems for known users that can be solved with digital systems AC9TDI2P01
Follow and describe algorithms involving a sequence of steps, branching (decisions) and iteration (repetition) AC9TDI2P02
Represent data as pictures, symbols, numbers and words AC9TDI2K02
This sequence enables students to:
- follow and describe an algorithm that involves a sequence of steps
- describe the parts of the algorithm that include branching and iteration
- describe ways to use digital systems to solve simple problems.
Resources to include
Resources to introduce

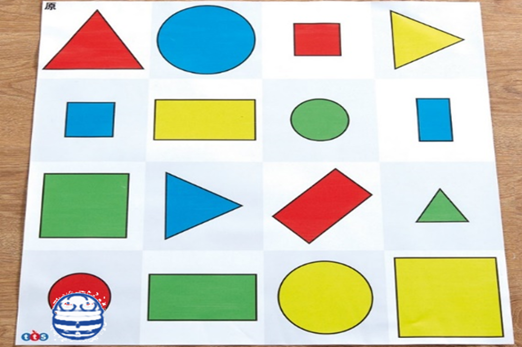
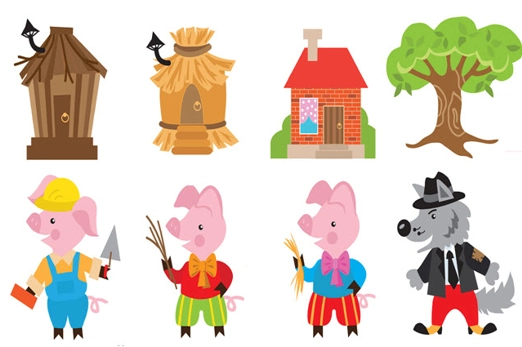
Years 1–2 Three little pigs: Make a map
Use this map to retell the story of the three little pigs by creating an algorithm using arrows to follow instructions. This activity enables students to explore branching and iteration.
Requires
- one printed worksheet per student
Suggested time
1 hourEnables students to:
- follow and describe an algorithm that involves a sequence of steps
- use arrows as a form of representation to describe directional movement
- describe the parts of the algorithm that include branching and iteration.
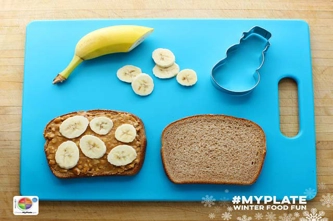
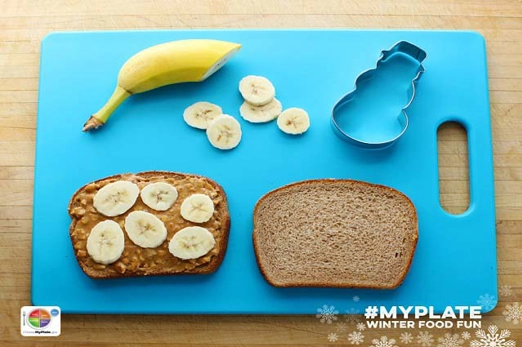
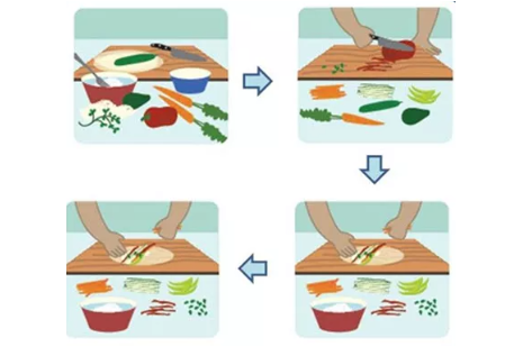
Years 1–2 Plant a seed worksheet
Use this worksheet to sequence steps of planting a seed.
Requires
- one printed worksheet per student
Suggested time
30 minutesEnables students to:
- follow and describe an algorithm that involves a sequence of steps
- use arrows as a form of representation to describe directional movement.
Resources to develop and consolidate learning
-
Planting fruit and vegetables
Find out more -
Snap block models
Find out more -
Yulunga traditional Indigenous games
Find out more


Years 1–2 Planting fruit and vegetables
In this sequence of lessons, students grow a plant from a seed, capturing each step and decision as an algorithmic process and recording data for future learning. This activity enables students to explore branching and iteration.
Requires
- seeds, potting mix and pots
- device with camera to photograph stages of seedling growth
Suggested time
extended periodEnables students to:
- identify the needs of a plant
- represent data as sound, images and text
- follow and describe an algorithm that involves a sequence of steps
- describe the parts of the algorithm that include branching and iteration.
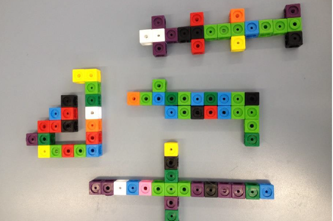
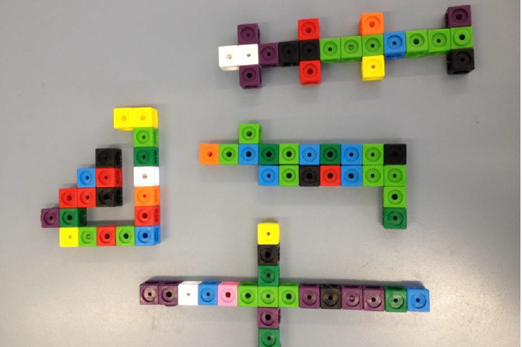
Years 1–2 Snap block models
Create a model using snap blocks that is one block high, and create a code so someone else can build your model. This activity enables students to explore branching and iteration.
Requires
- a class set of snap blocks or similar interlocking blocks
Suggested time
1 hourEnables students to:
- create a model using up to 20 snap blocks
- follow and describe an algorithm that involves a sequence of step
- use arrows as a form of representation to describe directional mo
- represent data as sound, images and text
- describe the parts of the algorithm that include branching and iteration.
Years 1–2 Yulunga traditional Indigenous games
Use these traditional games for students to create their own algorithms to teach other students to play the game. This activity enables students to explore branching and iteration.
Requires
- internet access
- computer and interactive whiteboard to display website
- downloadable instruction sheets (selected by each group)
Suggested time
1 hourEnables students to:
- describe how to play a traditional Australian First Nations game
- represent data as sound, images and text
- follow and describe an algorithm that involves a sequence of steps
- describe the parts of the algorithm that include branching and iteration.

Resources to apply and extend learning
Years 1–2 Three little pigs
Retell the story of the three little pigs using a light-sensing robot such as Ozobot. This activity enables students to explore branching and iteration.
Requires
- class set of Ozobots
- one printed worksheet per student
Suggested time
2-3 hoursEnables students to:
- retell a story using sounds, images and words
- create and follow an algorithm that describes a series of steps
- describe the parts of the algorithm that include branching and iteration.
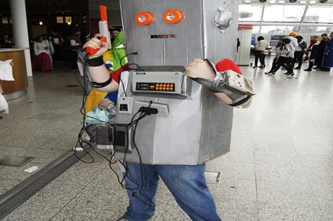
Years 1–2 Cross age making a robot
This lesson sequence is a cross-age project that can be used for students in Years 5–6 in collaboration with students in Years F–2. In this project, students collaborate on a code for an unplugged robot. They design, test and modify the robot and create instruction manuals.
Requires
- recycled materials to build a robot costume
Suggested time
2-3 hoursEnables students to:
- follow and describe an algorithm that involves a sequence of steps
- describe the parts of the algorithm that include branching and iteration.

Ways we represent data
Overview
In this unit students represent objects, ideas and events as pictures, symbols, numbers and words. Students represent the data they have acquired in different ways.
Achievement standards
By the end of Year 2, students represent and process data in different ways.
Australian Curriculum
Content descriptions
Data representation AC9TDI2K02
Related content and General capabilities
Mathematics
Acquire and record data for categorical variables in various ways including using digital tools, objects, images, drawings, lists, tally marks and symbols AC9M1ST01
Acquire data for categorical variables through surveys, observation, experiment and using digital tools; sort data into relevant categories and display data using lists and tables AC9M2ST01
General capabilities
Digital Literacy: Investigating
Numeracy: Statistics and probability
This topic enables students to
- explain how an object, picture or symbol stands for an idea or observation
- represent data in different ways such as pictures, symbols, numbers and words
- conduct a simple survey to acquire responses (Mathematics)
- record the survey responses using tally marks, numbers or pictures
- represent data as images, symbols or pictures.
Watch this video for a quick overview of the unit and how to use its resources with your students.
Assessment View assessment advice
Assessment tasks
Use this work sample, WS01 – Organising ideas: My school, to assess students’ knowledge and skills related to representing and processing data in different ways. The primary purpose for the work sample is to demonstrate the standard, so the focus is on what is evident in the sample not how it was created.
Use this task, Glyphs F–2, to assess students’ knowledge and skills related to representing data.
Rubric: Data representation
| Knowledge of data representation | with guidance, identifies types of data | identifies types of data and names them such as picture, symbol or object | identifies types of data and names them such as picture, symbol or object and explains what they represent | identifies types of data and names them and explains what they represent and why we might use that representation |
| Demonstrates ways to represent data | with guidance, represents data using a picture, symbol or object | uses pictures, symbols or objects to represent ideas or actions | uses pictures, symbols or objects to represent ideas or actions, discussing the features that make them easily recognisable | uses pictures, symbols or objects to represent ideas or actions, discussing the features that make them easily recognisable, and justifies their choice |
Unit sequence
This topic offers 2 sequential units
Unit 1
Representing ideas and actions
Students represent data as pictures, symbols, numbers and words.Unit 2
Representing data we acquire
Students represent the data they have acquired in different ways.Representing ideas and actions
What is this about?
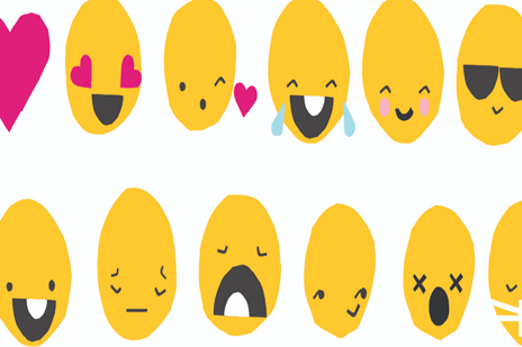
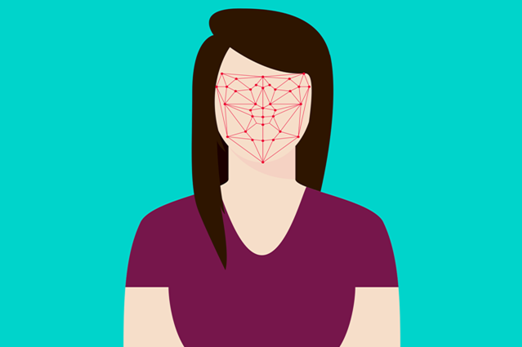
In Digital Technologies, representing data refers to the way data is symbolised, visually treated or provided in audio. For example, at this level, data about animals may be represented as images, emotions may be represented as emojis, and weather data may be represented as icons for wind, rain or describing the amount of sunshine.
Content description
Represent data as pictures, symbols, numbers and words AC9TDI2K02
This sequence enables students to:
- explain how an object, picture or symbol stands for an idea or observation
- represent data in different ways such as pictures, symbols, numbers and words.
Resources to include
Resources to introduce

1–2 What is data?
Use these slides to explain the term ‘data’.
Requires
- internet connectivity
- computer and interactive whiteboard to display website
Suggested time
30 minutesEnables students to:
- identify types of data
- identify ways data is represented.
1–2 Emoji time
Explore the use of emojis to represent feelings.
Requires
- print game cards (enough for students in small groups)
Suggested time
1 hourEnables students to:
- describe the key facial features that help us recognise a person’s emotions
- draw and recognise different faces that represent an emotion such as sad, happy or angry.
Resources to develop and consolidate learning
-
Weather data representation
Find out more -
Can AI guess your emotion?
Find out more -
Can an AI recognise what you are drawing?
Find out more
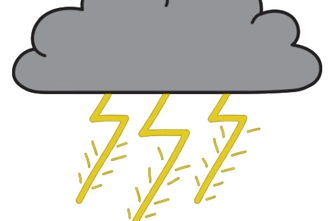
1–2 Weather data representation
Use this lesson to explore ways to represent weather using symbols and learn about First Nations perspectives on weather.
Requires
- internet connectivity
- computer and interactive whiteboard to view slides and videos
Suggested time
1–2 hoursEnables students to:
- design their own icons to depict different weather events
- interpret different sources of information (image, sound, number, text) and what they may represent.

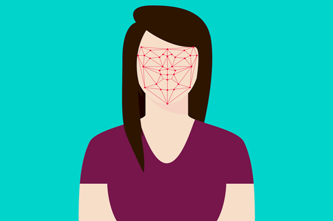
1–2 Can AI guess your emotion?
Use this lesson to explore using emojis to represent feelings or emotions.
Requires
- internet connectivity
- computer and interactive whiteboard to display Teachable Machine website
- access to printed emojis
Suggested time
1 hourEnables students to:
- describe the key facial features that help us recognise a person’s emotions
- draw and recognise different faces that represent an emotion such as sad, happy or angry.
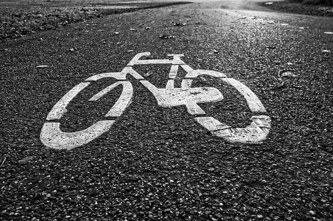
1–2 Can an AI recognise what you are drawing?
This lesson provides an opportunity to incorporate representation of data using a relevant context being studied in the classroom.
Requires
- internet connectivity
- computer and interactive whiteboard to display AutoDraw website
Suggested time
1 hourEnables students to:
- describe the key features of objects that help us recognise the object
- draw objects focusing on the features that make them recognisable.

Resources to apply and extend learning
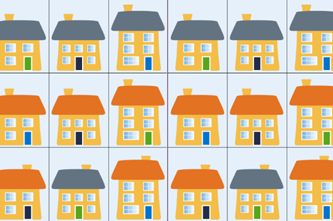

1–2 Sort the street
Use this activity to explore ways to represent a house. Use the house parts to represent family data.
Requires
- printed worksheet
Suggested time
1 hourEnables students to:
- sort images according to attributes
- represent data using images.

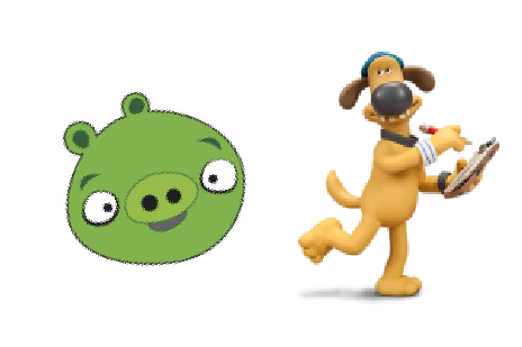
1–2 Is it a pig or dog?
Use this take-home activity to explore data representation.
Requires
- printed worksheet
Suggested time
30 minutesEnables students to:
- describe the key features that help us recognise an animal
- draw and recognise different animals representing their key features.
Professional learning

1–2 Data representation
Use this infographic to explore ways to represent data for your year level.
Suggested time
30 minutes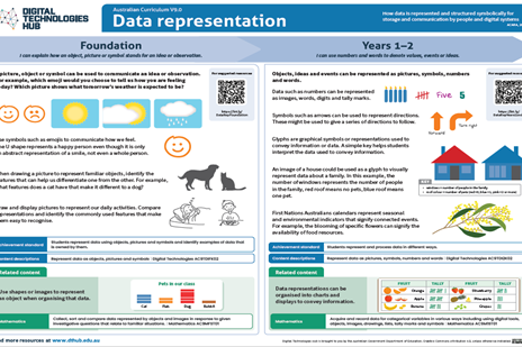
Representing data we acquire
What is this about?
This aspect of Digital Technologies has strong connections to the Mathematics learning area and can be integrated to make learning more meaningful. In Mathematics students acquire and record data that can be ranked or ordered, such as a temperature scale from cold to hot, and those data that cannot be ranked or ordered, such as eye colour or types of pets. The focus in Digital Technologies is how to work with the data in digital form and how it is represented. Data such as numbers can be represented as images, words, digits and tally marks. Glyphs are graphical symbols or representations used to convey information or data. A simple key helps students interpret the data used to convey information.
Content description
Represent data as pictures, symbols, numbers and words AC9TDI2K02
This sequence enables students to:
- conduct a simple survey to acquire responses
- record the survey responses using tally marks, numbers or pictures
- represent data as images, symbols or pictures.
Supplementary information
Many teaching resources related to acquiring data include gender as a category. Be mindful of sensitivities related to this form of data acquisition.
Resources to include
Resources to introduce

1–2 All about me
Discuss ways to represent each type of data they record about themselves.
Requires
- printed worksheet
Suggested time
1 hourEnables students to:
- acquire data about themselves including data that is owned by them
- represent data as images, symbols or pictures.
1–2 Organising information
Use the context of organising information to explore ways to represent data.
Requires
- internet connectivity
- computer and interactive whiteboard to display website
Suggested time
1 hourEnables students to:
- organise data into groups
- represent data using images, symbols and text.
Resources to develop and consolidate learning
-
Data collection and representation: What’s in your lunchbox? (F–2)
Find out more -
Mr Brown Can Moo! Can You? Dr. Seuss read along aloud book
Find out more -
And to Think That I Saw It on Mulberry Street Dr. Seuss read along aloud book
Find out more

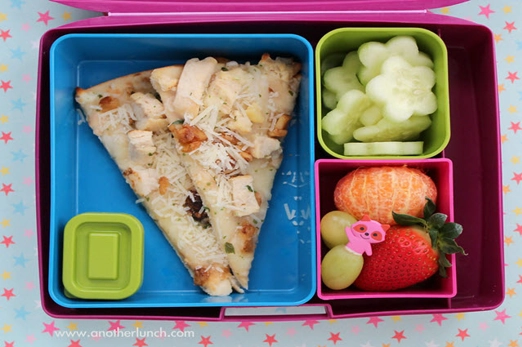
1–2 Data collection and representation: What’s in your lunchbox? (F–2)
The type of fruits and vegetables in school lunchboxes or those eaten at crunch and sip or fruit break time can provide a good source of data for a classroom investigation.
Requires
- school lunchboxes
- devices with camera such as a tablet
Suggested time
1 hourEnables students to:
- organise data into groups
- represent data using images, symbols and text.
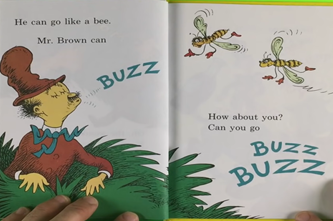
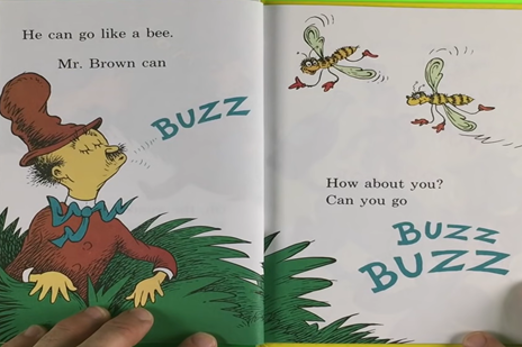
1–2 Mr Brown Can Moo! Can You? Dr. Seuss read along aloud book
Use this video to acquire data, representing the different types and number of animals featured in the story using pictures, numbers and tally marks.
Requires
- internet connectivity
- computer and interactive whiteboard to display video
Suggested time
1 hourEnables students to:
- organise data into groups
- represent data using images, symbols and text.
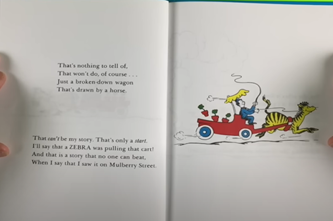
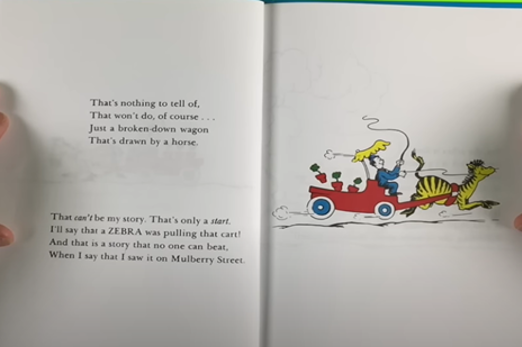
1–2 And to Think That I Saw It on Mulberry Street Dr. Seuss read along aloud book
Use this video to acquire data, representing the different types and number of animals featured in the story using pictures, numbers and tally marks.
Requires
- internet connectivity
- computer and interactive whiteboard to display video
Suggested time
1 hourEnables students to:
- organise data into groups
- represent data using images, symbols and text.
Resources to apply and extend learning
-
Data detective
Find out more -
Schoolyard biodiversity detectives
Find out more -
Mathematics – K-2 multi-age – Year A – Unit 7
Find out more -
Rhythm clock game for classroom elementary or primary music lessons
Find out more

1–2 Data detective
With support, students conduct a simple survey to acquire, organise and present data. In doing so, they demonstrate their understanding of how to use patterns to represent data symbolically.
Requires
- printed worksheets
Suggested time
1 hourEnables students to:
- conduct a simple survey to acquire responses from friends
- record the survey responses using tally marks, numbers or pictures
- organise the data using tables and lists.

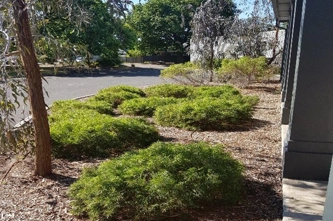
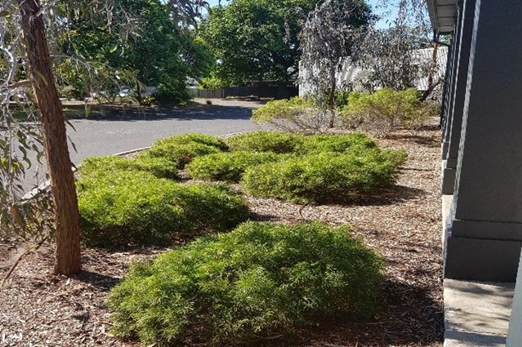
1–2 Schoolyard biodiversity detectives
Acquire data on the biodiversity in garden beds around your school to measure the biodiversity (that is, the different types of plants and animals). Explore ways to represent and present data.
Requires
- device with camera
- tablet or laptop with drawing software
Suggested time
1 hourEnables students to:
- draw and display pictures to represent our daily activities
- compare representations and identify the commonly used features that make them easy to recognise.
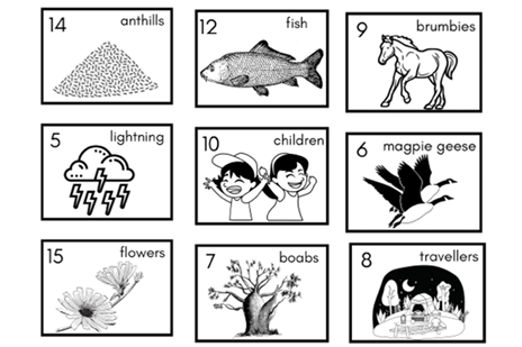
1–2 Mathematics – K-2 multi-age – Year A – Unit 7
Data can be represented as a symbol, like a glyph. Students acquire class data about themselves and represent each category response as a glyph to create a ‘biography data face’. Refer to Lesson 4: Biography glyphs.
Requires
- printed worksheets
Suggested time
1 hourEnables students to:
- acquire data about themselves
- represent data using symbols.

1–2 Rhythm clock game for classroom elementary or primary music lessons
Use this video to explore ways to represent musical rhythm patterns.
Requires
- internet connectivity
- computer and interactive whiteboard to display video
Suggested time
1 hourEnables students to:
- represent data using symbols.
Professional learning

1–2 Glyphs! Data communication for primary mathematicians
Use this resource for further ideas about using glyphs to represent data.
Suggested time
30 minutes
Sharing content and collaborating
Overview
This unit introduces students to using the basic features of common digital tools to share content and collaborate. Students learn about using appropriate behaviours when working with others and sharing content. They also access school computer systems safely.
Achievement standards
By the end of Year 2 students use the basic features of common digital tools to create, locate and share content, and to collaborate, following agreed behaviours.
Australian Curriculum
Content descriptions
Collaborating and managing AC9TDI2P04, AC9TDI2P05
Privacy and security AC9TDI2P06
Related content and General capabilities
Digital Literacy: Practising digital safety and wellbeing, Managing and operating
This topic enables students to
- identify features of common digital tools
- describe how to use features of common digital tools for a particular purpose
- collaborate with others to complete a task using common digital tools, applying agreed behaviours.
Watch this video for a quick overview of the unit and how to use its resources with your students.
Assessment View assessment advice
Use the Seesaw activity: What is a Bee-Bot? to assess students’ skills, knowledge and processes related to the use of common digital systems for a purpose. In this task students work collaboratively to use the Seesaw application to add words to describe a photo of a Bee-Bot, and use the microphone to explain how a Bee-Bot works.
Use these rubrics to assess students’ proficiency in:
- use of common digital tools
- knowledge of agreed class behaviours and collaborating and applying those behaviours
- accessing school computer systems safely.
Rubric: Common digital systems
| Demonstrates basic features of common digital tools to create, locate and communicate content | with guidance, demonstrates the use of the basic features of a common digital tool | demonstrates the use of a common digital tool | demonstrates the use of a common digital tool and describes its purpose | selects a digital tool for a given purpose, demonstrates its use and justifies their choice of tool |
| Collaborating using agreed behaviours | with guidance, identifies appropriate and inappropriate behaviour when working with others | identifies appropriate and inappropriate behaviour when working with others and follows a set of rules or instructions that are agreed class behaviours | describes appropriate and inappropriate behaviour when working with others, follows a set of rules or instructions that are agreed class behaviours, and explains why the rules are important | describes appropriate and inappropriate behaviour when working with others; follows and encourages others to follow a set of rules or instructions that are agreed class behaviours; and explains why the rules are important, giving examples |
| Access school computer systems safely | with guidance, can access the school computer systems safely | can access the school computer systems safely using supplied password and username | can access the school computer systems safely using recorded password and username | can access the school computer systems safely using recorded password and username. Explains why it is important to keep their password safe |
Unit sequence
This topic offers 1 unit
Common digital systems we use
What is this about?
Students develop skills in working together on a digital task that uses features of common digital tools. They develop an understanding of the need to apply agreed behaviours to help ensure respectful behaviour in group situations and working safely online. They develop their ability to navigate school computer systems securely. Students can work collaboratively on a task; for example, using word processing or presentation software, or other applications on which they can take turns working on the same document or digital environment.
Content descriptions
Use the basic features of common digital tools to create, locate and communicate content AC9TDI2P04
Use the basic features of common digital tools to share content and collaborate demonstrating agreed behaviours, guided by trusted adults AC9TDI2P05
Access their school account with a recorded username and password AC9TDI2P06
This sequence enables students to:
- identify features of common digital tools
- describe how to use features of common digital tools for a particular purpose
- collaborate with others to complete a task using common digital tools, applying agreed behaviours.
Resources to include
Resources to introduce
-
How can we be respectful and responsible online?
Find out more -
Slide sorter
Find out more -
Seesaw activity: Life cycle of a sunflower coding
Find out more


Years 1–2 How can we be respectful and responsible online?
Use this resource to discuss respectful behaviours when collaborating and responsible, safe behaviours online.
Requires
- internet connectivity
- computer and interactive whiteboard to display website
Suggested time
30 minutesEnables students to:
- describe and apply appropriate behaviours when working with others, when sharing content and when online.

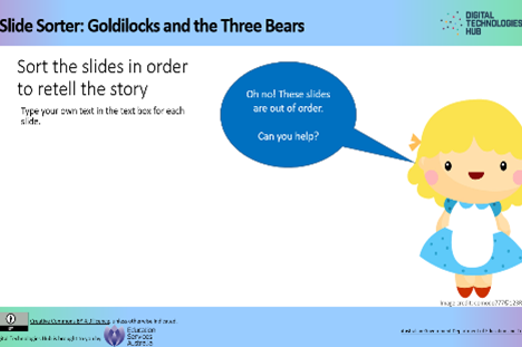
Years 1–2 Slide sorter
Students work collaboratively to sort the slides into the correct sequence to retell a familiar fairytale.
Requires
- internet connectivity
- computer and interactive whiteboard to display slides
- access to slides for each group of students working collaboratively
Suggested time
1 hourEnables students to:
- use common digital systems for a purpose
- sequence a series of slides in correct order to retell a fairytale.
Years 1–2 Seesaw activity: Life cycle of a sunflower coding
Demonstrate the use of a digital tool to represent the life cycle of a sunflower. Students can collaboratively complete the task.
Requires
- teacher account for Seesaw, save the task and assign to students
- internet connectivity
- computer and interactive whiteboard to display task; or printed cards – provides handout one per child
Suggested time
1 hourEnables students to:
- use common digital systems for a purpose
- sequence a series of steps in correct order to represent the life cycle of a plant.

Resources to develop and consolidate learning
-
How do we use digital devices?
Find out more -
How do we use search tools?
Find out more -
Kiddle
Find out more

Years 1–2 How do we use digital devices?
Use this resource to discuss the digital devices we commonly use. Ask students to complete the task with a partner working collaboratively.
Requires
- internet connectivity
- computer and interactive whiteboard to display task
- access to Seesaw and assign task to students
Suggested time
30 minutesEnables students to:
- identify some common digital systems
- describe a common digital system and its particular purpose
- complete a task collaboratively following agreed behaviours.
Years 1–2 How do we use search tools?
Use this resource to explain how we use the internet to search for and locate information.
Requires
- internet connectivity
- computer and interactive whiteboard to display task
Suggested time
30 minutesEnables students to:
- identify some common digital systems
- describe a common digital system and its particular purpose.
Years 1–2 Kiddle
Use this student-friendly search engine to locate content on the internet.
Requires
- internet access
- computers, laptops or tablets
- access to Kiddle online search engine
Suggested time
30 minutesEnables students to:
- describe the types of content available on the internet
- describe how to use a search engine to locate content available on the internet
- describe ways to stay safe online.
Resources to apply and extend learning
Years 1–2 How our class stays safe online
This resource can be used in the classroom to teach students aged 5 to 8 years about safe online behaviour. It includes discussion questions, a poster and guidelines about how to create a tech agreement.
Requires
- internet connectivity
- computer and interactive whiteboard to display website
Suggested time
1 hourEnables students to:
- describe and apply appropriate behaviours when working with others, when sharing content and when online.

Years 1–2 Creating a digital system
Provide this take-home activity to be completed as a family task.
Requires
- access to markers, recycled materials, scissors and glue
Suggested time
1 hourEnables students to:
- identify some common digital systems
- use common digital tools for a particular purpose.
