Scope and sequence (F–10)
Learning programs to support implementation
Sequenced topics that could be used in teaching the Australian Curriculum Digital Technologies curriculum to address the content descriptions of the curriculum. The Scope and sequence has been updated to support teachers to implement AC:DT V9.0.
Select a topic across a two year cycle
Recommended any combination of three topics per year.
Choose a combination of units that suits your students and context.
Cycle one (Year 7)
Cycle one (Year 7)
| Jan | Jun | Dec | |||||||||
|---|---|---|---|---|---|---|---|---|---|---|---|
Cycle two (Year 8)
| Jan | Jun | Dec | |||||||||
|---|---|---|---|---|---|---|---|---|---|---|---|
Binary numbers
Overview
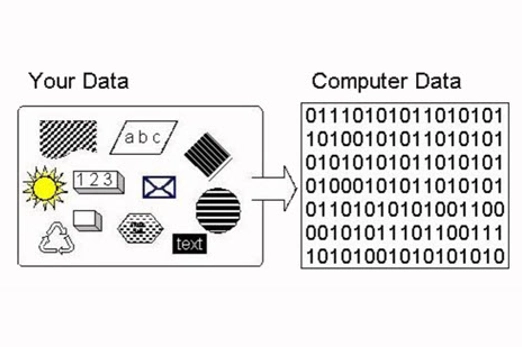
This unit introduces students to the binary system of ones and zeros used by digital technology to store and process numbers. They also learn how text, images and sound can be stored this way.
Achievement standards
By the end of Year 8 students acquire, interpret and model data with spreadsheets and represent data with integers and binary.
Australian Curriculum
Content descriptions
Data representation AC9TDI8K03, AC9TDI8K04
Related content and General Capabilities
Mathematics: Number AC9M7N02
Digital Literacy: Managing and operating
Critical and Creative Thinking
This topic enables students to
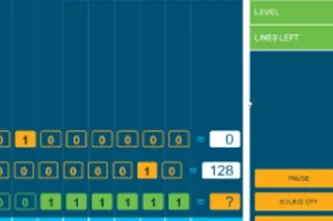
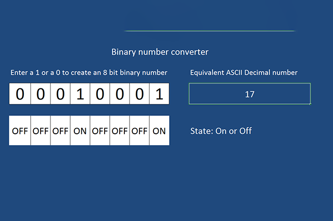
- convert whole numbers between decimal and binary
- demonstrate how text, colour, images and sound are stored in binary form
- discuss why digital technology uses binary to process and store data.
Supplementary information
The four sequences in this unit are designed to be covered in order.
Watch this video for a quick overview of the unit and how to use its resources with your students.
Assessment View assessment advice
Achievement standards
Digital Technologies: Years 7-8
By the end of Year 8 students acquire, interpret and model data with spreadsheets and represent data with integers and binary.
Assessment tasks
Use this work sample Binary explainer video that shows a student's response to the task: Create a video to explain binary for text, image and sound to a peer.
Use this work sample Designing and implementing a podcast for students to create a podcast where an interviewer and interviewee discuss counting in binary without visual aids.
Rubrics
Use these two rubrics to assess student skills, processes and knowledge.
Representing integers with binary
This rubric provides benchmarks for assessing different levels of complexity and proficiency in:
- counting up using binary bits (ones and zeros)
- converting positive, whole numbers between decimal (base-10) and binary (base-2) form
- describing why digital technology uses binary to store and process numbers.
Representing data with integers
This rubric provides benchmarks for assessing different levels of complexity and proficiency in:
- converting text into number codes using ASCII
- identifying RGB numbers for pixel colours in an image
- describing how sounds are sampled to produce a sequence of numbers.
Rubric: Representing integers with binary
| Counting up using binary bits (ones and zeros) | demonstrates understanding of binary one and zero representing their equivalents one and zero in decimal | performs counting from zero up to at least 7 using binary bits | performs counting from zero up to at least 7 using binary bits; shows understanding of the increasing number of bits required to reach larger numbers | performs counting from zero up to at least 15 using binary bits; shows understanding of the increasing number of bits required to reach larger numbers |
| Converting positive, whole numbers between decimal (base-10) and binary (base-2) form | demonstrates limited understanding of how to convert numbers between decimal and binary form | using appropriate tools, consistently converts whole numbers between zero and 31 to binary form | using appropriate tools, consistently converts whole numbers between zero and 31 to binary form; demonstrates understanding of place value in base-2 digits | using appropriate tools, consistently converts whole numbers between zero and 127 to binary form; demonstrates understanding of place value in base-2 digits |
| Describing why digital technology uses binary to store and process numbers | demonstrates limited understanding of why digital technology uses binary to store and process numbers | demonstrates basic awareness that digital technology relies on off-on states for the storage and/or processing of data | employs vague or abstract references to digital hardware to describe why it uses binary to store and process numbers | employs clear references to digital hardware to describe why it uses binary to store and process numbers |
Rubric: Representing data with integers
| Converting text into number codes using ASCII | demonstrates limited understanding of numerical ASCII codes representing text characters | makes mostly correct conversions of text characters into numerical ASCII codes or their binary forms | makes mostly correct conversions of text characters into numerical ASCII codes and their binary forms | consistently makes correct conversions of text characters into numerical ASCII codes and their binary forms |
| Identifying RGB numbers for pixel colours in an image | demonstrates limited understanding of how colours are represented digitally | identifies correct red, green and blue numbers for RGB colours most of the time | identifies correct red, green and blue numbers for RGB colours most of the time; demonstrates understanding of how number of bits affects available number of colours | consistently identifies correct red, green and blue numbers for RGB colours; demonstrates understanding of how number of bits affects available number of colours |
| Describing how sounds are sampled to produce a sequence of numbers | demonstrates limited understanding of how sounds are sampled to produce a sequence of numbers | describes in basic terms the mapping of sound waveforms | describes in basic terms the mapping of sound waveforms; demonstrates understanding of how the number of bits affects accuracy of digital sound | uses appropriate vocabulary to describe the mapping of sound waveforms; demonstrates understanding of how bit rate and sample rate affect accuracy of digital sound |
Unit sequence
This topic offers 4 sequential units
Unit 1
Numbers to binary
Students learn to convert whole numbers into binary.Unit 2
Text to binary
Students learn to use the ASCII system for encoding and explore the Unicode system.Unit 3
Images to binary
Students learn about raster images and vector images are stored in computers.Unit 4
Sound to binary
Students learn about how digital audio is stored and represented in computers.Numbers to binary
What is this about?
The nature of digital systems means that they store and process numbers in binary form, as sequences of zeros and ones. Students can learn to convert whole numbers into binary via multiple paths: by recognising patterns when counting in binary, by creating a conversion table, by understanding binary as a base-2 number system, and by using digital tools to convert numbers back and forth.
Content description
Explain how and why digital systems represent integers in binary AC9TDI8K04
This sequence enables students to:
- count in binary
- convert whole numbers between decimal form and binary form
- discuss how the number of binary digits limits the size of values stored
- understand why digital systems store and process numbers in binary.
Resources to include
Resources to introduce


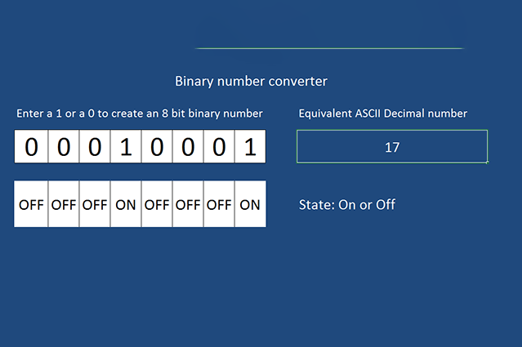
Years 7–8 How binary digits work?
Create bracelets using the binary of letters in your name.
Requires
- beads and string material
Suggested time
2 hoursEnables students to:
- practice counting in a binary (base-2) system.

Years 7–8 Why Do Computers Use 1s and 0s?
Watch this video to introduce why computers use binary.
Requires
- internet access
- computers, laptops or tablets to view video
Suggested time
7 minsEnables students to:
- explore why digital technology uses binary to store and process data.
Resources to develop and consolidate learning
-

Introduction to binary
Find out more -
The binary game
Find out more -
Binary memory game
Find out more -
Creating my own spreadsheet
Find out more


Years 7–8 Introduction to binary
Use this lesson to reinforce and practise counting in binary.
Requires
- printed sheets (documents provided)
Suggested time
1 hourEnables students to:
- practise counting in a binary (base-2) system.

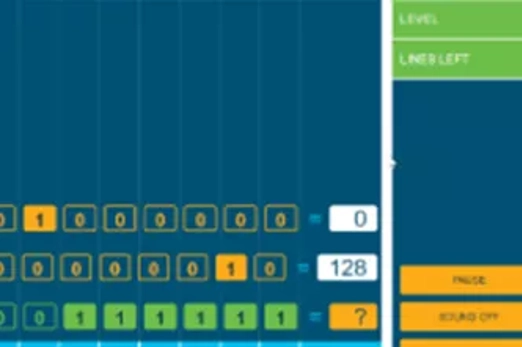
Years 7–8 The binary game
Play an online game to practise converting between decimal and binary.
Requires
- internet access
- computers, laptops or tablets
Suggested time
30 minutesEnables students to:
- practise converting between decimal and binary numbers.
Years 7–8 Binary memory game
Play an unplugged memory game to practise converting between decimal and binary.
Requires
- printed sheets (documents provided)
Suggested time
30 minutesEnables students to:
- practise converting between decimal and binary numbers.

Years 7–8 Creating my own spreadsheet
Create a spreadsheet to convert decimal numbers to binary in this lesson.
Requires
- computers, laptops or tablets
- spreadsheet software (for example, Excel, Sheets, Numbers)
Suggested time
1 hourEnables students to:
- automate the conversion of binary to decimal numbers.
Resources to extend and integrate learning
-
Representing numbers and letters with binary
Find out more -
Data representation – binary module
Find out more -
Hexadecimal
Find out more


Years 7–8 Representing numbers and letters with binary
Watch this video to extend into concepts such as floating point and digital storage.
Requires
- internet access
- computers, laptops or tablets to view video
Suggested time
11 minutesEnables students to:
- explore concepts of binary storage in more depth, including the floating-point system used to store non-integers.

Years 7–8 Data representation – binary module
Work through this online module to combine Python programming with binary concepts. Not recommended for introducing Python coding for the first time. See unit General-purpose programming.
Requires
- internet access
- computers, laptops or tablets
- free Grok learning accounts
Suggested time
2 hoursEnables students to:
- apply general-purpose programming in Python to work with binary numbers.

Years 7–8 Hexadecimal
Use this bite-sized lesson to extend into hexadecimal, a base-16 system with a close connection to binary.
Requires
- internet access
- computers, laptops or tablets
Suggested time
30 minutesEnables students to:
- convert numbers between binary, decimal and hexadecimal
- explore why hexadecimal is useful when working with binary.
Further reading and professional learning
-
Representation of numbers
Find out more -
Representing negative numbers in practice
Find out more -
Hexadecimal number system
Find out more
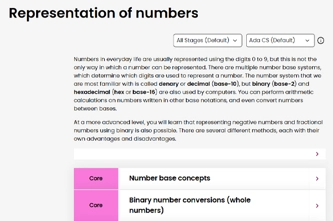
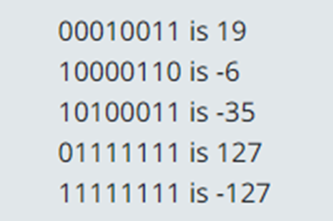

Years 7–8 Representation of numbers
This comprehensive online guide, provides a background to ways number is represented in computer systems. This topic provides information on binary (base-2) and hexadecimal (hex or base-16) that are used by computers.
Suggested time
30 minutes
Years 7–8 Representing negative numbers in practice
Read this online textbook segment about how negative numbers are represented.
Suggested time
30 minutes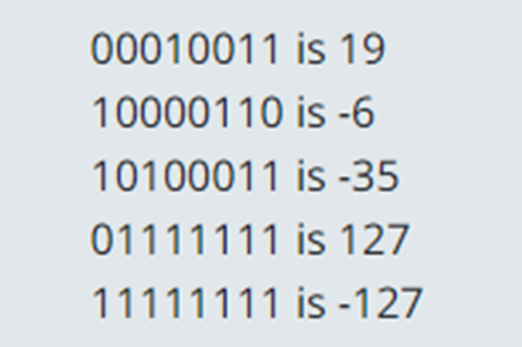
Years 7–8 Hexadecimal number system
Watch this video for a detailed explanation of the hexadecimal (base-16) system.
Suggested time
5 minutes
Text to binary
What is this about?
Since numbers are readily converted into binary form for computers to store and process, getting text into binary is achieved by expressing letters and other characters with numerical codes. Students can learn to use the ASCII system for encoding Latin letters and other characters this way, as well as exploring the much larger Unicode system.
Content description
Investigate how digital systems represent text, image and audio data using integers AC9TDI8K03
This sequence enables students to:
- express letters and other characters as numerical codes
- learn and apply ASCII codes
- explore the Unicode system
- make the connection from letters and characters to numbers, through to binary.
Resources to include
Resources to introduce


Years 7–8 Binary bracelets
Create bracelets using the binary of letters in your name.
Requires
- beads and string material
Suggested time
2 hoursEnables students to:
- encode the letters of their names in binary using ASCII codes.

Years 7–8 ASCII table
View the complete ASCII table with binary and decimal codes.
Requires
- internet access
- computers, laptops or tablets
Suggested time
1 hourEnables students to:
- explore why digital technology uses binary to store and process data.

Resources to develop and consolidate learning
-
ASCII and binary representation
Find out more -
ASCII quiz
Find out more -
Understanding ASCII and Unicode
Find out more -
Characters
Find out more
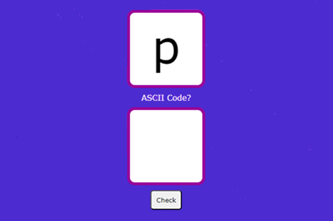


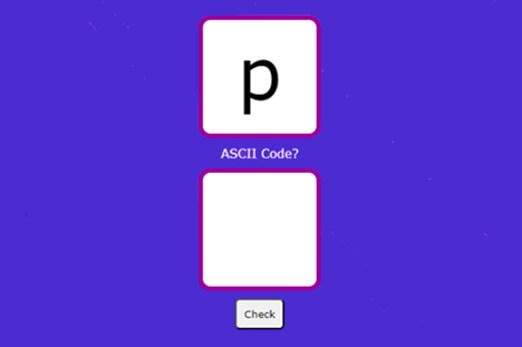
Years 7–8 ASCII and binary representation
Use this lesson to learn and practise converting text to binary with ASCII codes.
Requires
- printed sheets (documents provided)
Suggested time
1 hourEnables students to:
- learn and practise writing text in binary using ASCII codes.
Years 7–8 ASCII quiz
Practise ASCII numerical codes with this simple online quiz game.
Requires
- internet access
- computers, laptops or tablets
- ASCII table
Suggested time
30 minutesEnables students to:
- practise the numerical ASCII codes for letters.
Years 7–8 Understanding ASCII and Unicode
Watch this video for an introduction to the why and how of the Unicode system.
Requires
- internet access
- computers, laptops or tablets to view video
Suggested time
6 minutesEnables students to:
- explore the Unicode system, which allows for far more characters and symbols than ASCII.

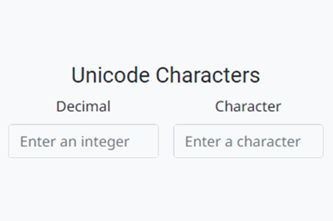
Years 7–8 Characters
Use this bite-sized lesson to recap and practise ASCII.
Requires
- computers, laptops or tablets
- spreadsheet software (for example, Excel, Sheets, Numbers)
Suggested time
30 minutesEnables students to:
- revise how to use ASCII codes to represent text characters as binary numbers.

Resources to extend and integrate learning

Years 7–8 Binary and data
Watch this video to cover binary and text and jump forward into how to store images and sound.
Requires
- internet access
- computers, laptops or tablets to view video
Suggested time
6 minutesEnables students to:
- get an overview of how text, images and sound are stored in binary.

Years 7–8 Data representation: text module
Work through this online module to combine Python programming with Unicode. Not recommended for introducing Python coding for the first time. See unit General-purpose programming.
Requires
- internet access
- computers, laptops or tablets
- free Grok learning accounts
Suggested time
2 hoursEnables students to:
- apply general-purpose programming in Python to work with Unicode.
Further reading and professional learning
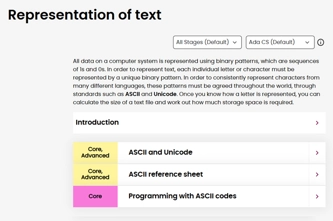
Years 7–8 Representation of text
This comprehensive online guide, provides a background to ways text is represented in computer systems. This topic has information about ASCII and Unicode.
Suggested time
30 minutes
Years 7–8 Introduction to Unicode
Read this online textbook segment to delve a little deeper into Unicode systems.
Suggested time
30 minutes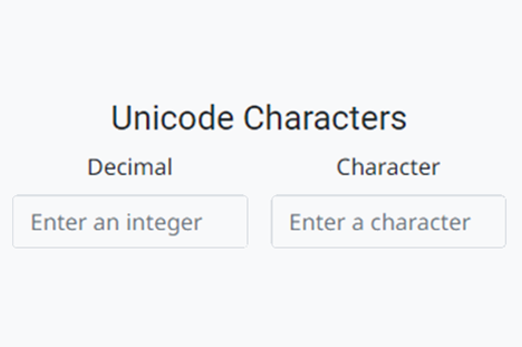
Images to binary
What is this about?
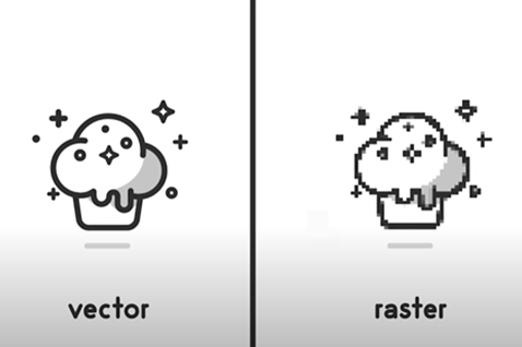
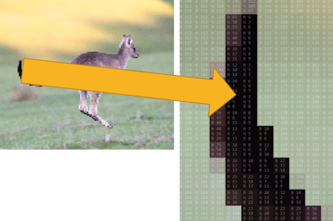
Since numbers are readily converted into binary form for computers to store and process, getting images into binary is achieved by representing them as sequences of numbers. Students can learn how each pixel in a raster image (like a photo) contains the numbers for its colour, while vector images (like clip art) are stored and drawn as geometrical paths.
Content description
Investigate how digital systems represent text, image and audio data using integers AC9TDI8K03
This sequence enables students to:
- understand and use the RGB system to represent any colour
- explain how raster images work
- explore how vector images work
- make the connection from images to numbers through to binary.
Resources to include
Resources to introduce

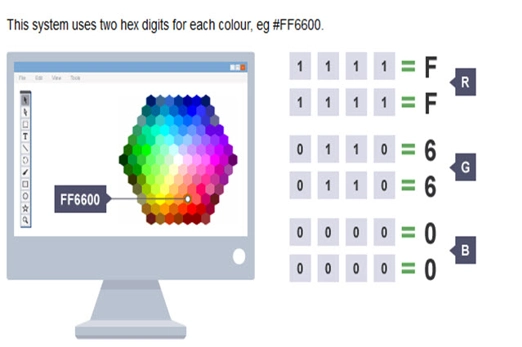
Years 7–8 Images, pixels and RGB
Watch this video to introduce key concepts about image representation.
Requires
- internet access
- computers, laptops or tablets to view video
Suggested time
6 minutesEnables students to:
- understand how any colour can be expressed by three numbers, for red, for green and for blue
- explore how raster images are a pixel mapping of a picture.
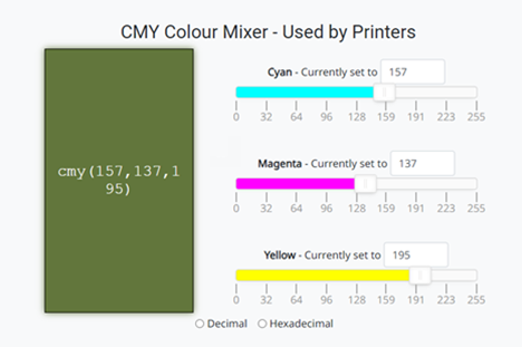
Years 7–8 Pixspy
Use this online tool to quickly and simply examine the pixels in any image. Without internet access, students can examine RGB colours using the eyedropper tool in many applications.
Requires
- internet access
- computers, laptops or tablets
Suggested time
30 minutesEnables students to:
- inspect any pixel of an image to see the red, green and blue number components for its colour.

Resources to develop and consolidate learning
-
Representing images in digital systems
Find out more -
Images and colours
Find out more -
Pixelation
Find out more -
Understanding bitmap pictures
Find out more -
What are vector and raster graphics?
Find out more


Years 7–8 Representing images in digital systems
Students learn about the RGB colour model and how digital systems use integers to represent images.
Requires
- internet access
- computers, laptops or tablets
Suggested time
1 hourEnables students to:
- test colours by adjusting red, green and blue values
- explore how increasing the number of binary digits allows for more colours
- revise knowledge.
Years 7–8 Images and colours
Use the interactives in this online textbook segment to explore the binary bits used in raster images.
Requires
- internet access
- computers, laptops or tablets
Suggested time
1 hourEnables students to:
- make the connection between red, green and blue numbers and binary.
Years 7–8 Pixelation
Work through this interactive tutorial to build raster images binary bit by binary bit.
Requires
- internet access
- computers, laptops or tablets
Suggested time
1 hourEnables students to:
- build raster images at the binary level
- explore how increasing the number of binary digits allows for more colours.
Years 7–8 Understanding bitmap pictures
Use this interactive blog post to learn and practise raster image concepts.
Requires
- internet access
- computers, laptops or tablets
Suggested time
30 minutesEnables students to:
- test colours by adjusting red, green and blue values
- explore how increasing the number of binary digits allows for more colours
- revise knowledge.

Years 7–8 What are vector and raster graphics?
Requires
- internet access
- computers, laptops or tablets to view video
Suggested time
2 minutesEnables students to:
- explore how vector and raster are very different ways of storing art, though both use sequences of numbers.
Resources to extend and integrate learning
-
Representation of images
Find out more -
The maths behind RGB images
Find out more -
Data representation: images module
Find out more -
Colours tutorial
Find out more -
Vector-based graphics
Find out more
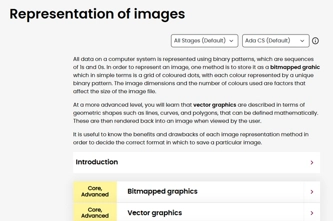

Years 7–8 Representation of images
This comprehensive online guide, provides a background to ways images are represented in computer systems. This topic has information about bitmapped graphics and vector graphics.
Suggested time
30 minutes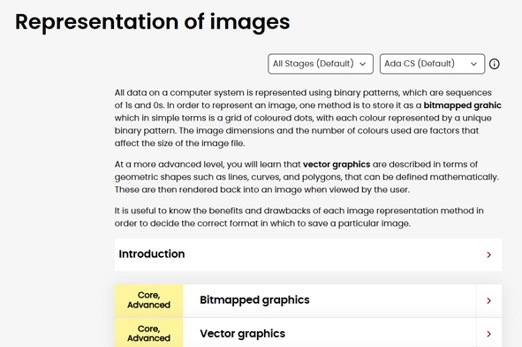
Years 7–8 The maths behind RGB images
In this lesson, students explore the colour model RGB and apply mathematical understandings to convert decimal numbers to binary.
Requires
- internet access
- computers, laptops or tablets
- access to digital tools Pixel viewer and RGB colour mixer
Suggested time
1 hourEnables students to:
- describe how digital systems represent integers in binary
- use mathematical operations of multiplication and division to convert a decimal number to binary.

Years 7–8 Data representation: images module
Work through this online module to combine Python programming with raster image concepts. Not recommended for introducing Python coding for the first time. See unit General-purpose programming.
Requires
- internet access
- computers, laptops or tablets
- free Grok learning accounts
Suggested time
2 hoursEnables students to:
- apply general-purpose programming in Python to work with raster images.
Years 7–8 Colours tutorial
Use this tutorial to combine RGB colour concepts with webpage coding.
Requires
- internet access
- computers, laptops or tablets
Suggested time
1 hourEnables students to:
- learn about and practise using RGB colour codes in webpage HTML and CSS.

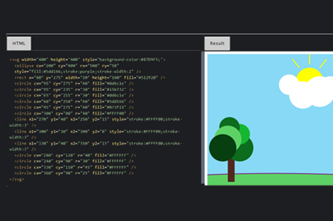
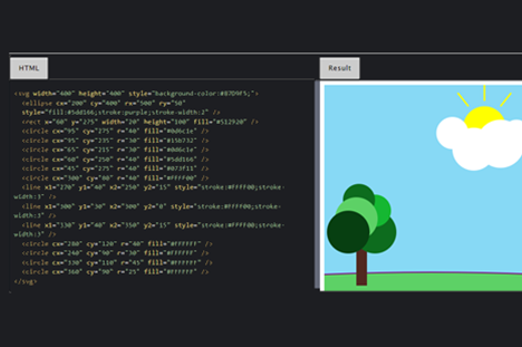
Years 7–8 Vector-based graphics
Use this tutorial to learn about the SVG format for vector graphics.
Requires
- internet access
- computers, laptops or tablets
Suggested time
1 hourEnables students to:
- learn about and practise writing code for vector graphics.
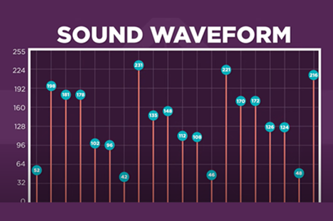
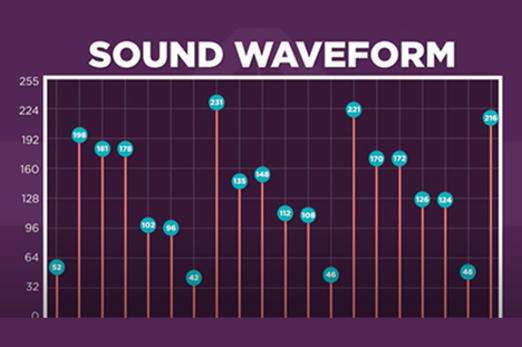
Sound to binary
What is this about?
Since numbers are readily converted into binary form for computers to store and process, getting sounds into binary is achieved by sampling their volume waveforms across time. Students can learn how this mapping is done, even visualising the sound waveform itself.
Content description
Investigate how digital systems represent text, image and audio data using integers AC9TDI8K03
This sequence enables students to:
- explore how sound is able to be mapped as a series of numbers
- practise using a digital audio editor to visualise waveforms
- make the connection from audio to numbers through to binary.
Resources to include
Resources to introduce
Years 7–8 Binary and data
The latter part of this video introduces at a basic level how audio is mapped.
Requires
- internet access
- computers, laptops or tablets to view video
Suggested time
6 minutesEnables students to:
- learn a basic concept for how audio is mapped and stored as a sequence of numbers.
Resources to develop and consolidate learning
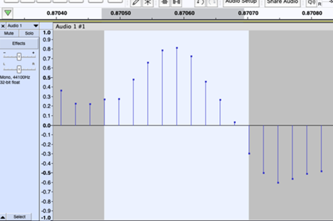
Years 7–8 Representing audio in digital systems
Use this lesson to investigate how a sound wave is sampled using popular audio software.
Requires
- computers or laptops
- installation of Audacity (free application)
Suggested time
1 hourEnables students to:
- use software to record audio and visualise its digital samples
- describe the effect of sample rate and bit rate on the accuracy of the sampled audio.

Resources to extend and integrate learning
-
Representation of sound
Find out more -
Digital compression
Find out more -
Sound output
Find out more -
Data representation: audio module
Find out more
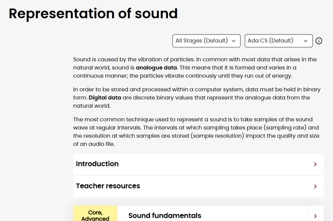

Years 7–8 Representation of sound
This comprehensive online guide, provides a background to ways sounds are represented in computer systems. This topic has information about data that is stored and processed within a computer system, must be in binary form (digital data).
Suggested time
30 minutes
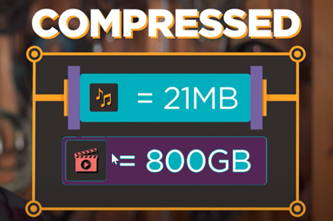
Years 7–8 Digital compression
Watch this video for a basic introduction to how digital text, images and audio are compressed to save bits.
Requires
- internet access
- computers, laptops or tablets to view video
Suggested time
3 minutesEnables students to:
- get an overview of how text, images and sound are stored in binary.
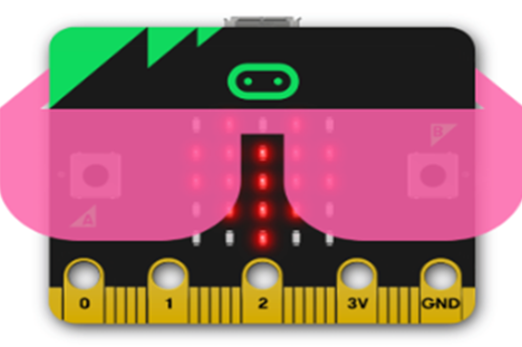
Years 7–8 Sound output
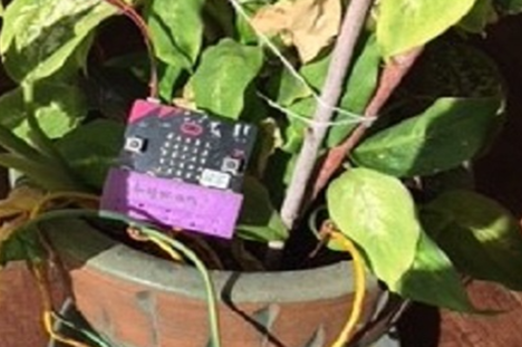
Use these micro:bit tutorials as a starting point for exploring the generation of sound with this device.
Requires
- internet access
- computers, laptops or tablets
- micro:bit devices
Suggested time
2 hoursEnables students to:
- produce sound from an electronic device
- use visual or general-purpose programming to code different pitches.

Years 7–8 Data representation: audio module
Work through this online module to combine Python programming with sound concepts. Not recommended for introducing Python coding for the first time. See unit General-purpose programming.
Requires
- internet access
- computers, laptops or tablets
- free Grok learning accounts
Suggested time
2 hoursEnables students to:
- apply general-purpose programming in Python to work with audio.
Working with data
Overview
This unit focuses on the skills required to acquire, analyse and visualise data. Students can acquire data from sources ranging from paper and digital surveys to electronic sensors and online data repositories. Spreadsheets and single-table databases can be used for data analysis and visualisation. At each stage, the digital footprint of data solutions is considered.
Achievement standards
By the end of Year 8 students acquire, interpret and model data with spreadsheets and represent data with integers and binary.
They select and use a range of digital tools efficiently and responsibly to create, locate and share content; and to plan, collaborate on and manage projects.
Students manage their digital footprint.
Australian Curriculum
Content descriptions
Acquiring, managing and analysing data AC9TDI8P01, AC9TDI8P02, AC9TDI8P03
Privacy and security AC9TDI8P14
Related content and General Capabilities
Mathematics: Statistics AC9M7ST03, AC9M8ST01, AC9M8ST04
Digital Literacy: Practising digital safety and wellbeing, Investigating, Managing and operating
Critical and Creative Thinking
This topic enables students to
- acquire data from surveys, electronic sensors and data repositories
- apply spreadsheet formulas and techniques to clean and analyse data
- create charts to visualise data
- explore how data is structured and queried in single-table databases
- consider digital footprints, assess which data is essential to purpose and depersonalise data where appropriate.
Supplementary information
This unit focuses on building specific skills rather than framing the data work process within a user story or context. The ‘Collaborative data project’ unit is designed to incorporate skills from this unit into a purposeful design project.
Watch this video for a quick overview of the unit and how to use its resources with your students.
Assessment View assessment advice
Achievement standards
Digital Technologies: Years 7–8
By the end of Year 8 students acquire, interpret and model data with spreadsheets and represent data with integers and binary.
They select and use a range of digital tools efficiently and responsibly to create, locate and share content; and to plan, collaborate on and manage projects.
Students manage their digital footprint.
Assessment task
Use this checklist and star rating for each student to assess students' demonstrated knowledge and skills related to the solar installations data task outlined in the lesson sequence Solar energy installations.
Use the rubric to assess students' proficiency in:
- acquiring, storing, and validating data from a range of sources using software
- analysing and visualising data using a range of software
- drawing conclusions and make predictions by identifying trends
- demonstrated knowledge of databases
- modelling and querying attributes using data.
Rubric: Acquiring, storing, validating, visualising, modelling and querying data
| Acquire, store, and validate data from a range of sources using software | needs guidance to acquire and store data from sources and may not validate data effectively | shows basic skills to acquire and store data from sources; attempts to validate data with some success | demonstrates accessing relevant data sources, imports and clean data, store data in an organised way ensuring that the data is accurate, reliable, and ready for analysis | demonstrates ability to acquire, store, and validate data from diverse sources using appropriate software, demonstrating thorough validation techniques and error checking |
| Analyse and visualise data using a range of software | needs guidance to analyse and visualise data; demonstrates basic understanding of software tools for analysis and visualisation, however, requires support | demonstrates basic ability to analyse and visualise data; uses software tools for analysis and visualisation with some support | demonstrates analysis and visualisation of data using relevant software; demonstrates understanding of software tools and explains ways to analyse and visualise data effectively | use advanced analysis techniques to derive deep insights from the data and creates complex and interactive visualisations that effectively communicate insights from the data, using advanced features of the software to enhance visual representation |
| Draw conclusions and make predictions by identifying trends | needs guidance to draw conclusions and make predictions from data; requires support and prompting to identify trends | demonstrates a basic ability to draw conclusions and make predictions from data; identifies trends with some accuracy | draws well considered conclusions referring to relevant data, makes logical predictions from data and identifies trends accurately | draws well-considered conclusions based on relevant data and the question being addressed, makes logical predictions using advanced statistical techniques and identifies complex trends and patterns in the data. |
| Knowledge of databases | needs guidance to understand basic database concepts | understands basic database concepts, but may struggle with applying them in practice | demonstrates a solid understanding of database concepts and can apply them effectively | demonstrates an advanced understanding of database concepts, including complex topics |
| Modelling and querying attributes using data | needs guidance to query attributes of objects and events using structured data; requires support to use software tools effectively for modelling and querying | basic ability to model and query attributes of objects and events using structured data; uses software tools for modelling and querying with some success | demonstrates ability to model and query attributes of objects and events using structured data; uses software tools effectively for modelling and querying | creates complex and dynamic models of objects and events using structured data and uses advanced querying techniques to extract specific information from large and complex datasets |
Unit sequence
This topic offers 3 sequential units
Unit 1
Acquiring data
Students practise different techniques for acquiring data, explore the forms in which this data comes, and consider privacy.Unit 2
Spreadsheets
Students will apply spreadsheet skills, such as filtering, formulas and chart creation.Unit 3
Databases
Students use databases that allow data to be structured in complex and organised ways.Acquiring data
What is this about?
Data can be collected from paper and digital surveys, from electronic sensors and from online data repositories. Students practise different techniques for acquiring data, explore the forms in which this data comes, and consider privacy by discussing the digital footprint of data solutions.
Content description
Acquire, store and validate data from a range of sources using software, including spreadsheets and databases AC9TDI8P01
Investigate and manage the digital footprint existing systems and student solutions collect and assess if the data is essential to their purpose AC9TDI8P14
This sequence enables students to:
- collect data from surveys and electronic sensors
- visit data repositories and examine the forms in which data can be acquired from them
- consider data privacy, digital footprints and how to assess which data is essential to purpose.
Supplementary information
Some of the suggested ideas enable integration of the Aboriginal and Torres Strait Islander Histories and Cultures cross-curriculum priority.
Resources to include
Resources to introduce
-
Acquiring and preparing data from online data repositories
Find out more -
Data Analysis
Find out more -
Women in data science introduction
Find out more -
Lexi's Coffee Business
Find out more


Years 7–8 Acquiring and preparing data from online data repositories
In this lesson, students develop skills to acquire, store and validate data from online data repositories. They learn how to navigate popular data sources and download data for use in spreadsheets.
Requires
- internet access, computers, laptops or tablets
- access to internet resources such as BOM
Suggested time
2 hoursEnables students to:
- understand how to access online data repositories
- set specific goals for data acquired
- navigate data repositories and download data
- identify common issues in downloaded data
- clean and prepare data for analysis.
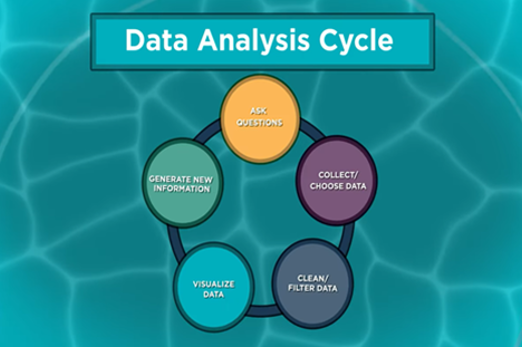
Years 7–8 Data Analysis
Watch this video for an overview of the full data analysis process that includes data collection.
Requires
- internet access
- computers, laptops or tablets to view video
Suggested time
3 minutesEnables students to:
- see an example of the big picture process of asking questions, collecting cleaning/ filtering and visualising data, and generating information.
Years 7–8 Women in data science introduction
Watch this video for a peek at some of the work of real data scientists.
Requires
- internet access
- computers, laptops or tablets to view video
Suggested time
8 minutesEnables students to:
- gain exposure to the work of real-world data scientists.

Years 7–8 Lexi's Coffee Business
Use this unplugged lesson to explore how data is used by businesses, and tips for designing a survey.
Requires
- printouts (included in the document)
Suggested time
1 hourEnables students to:
- conduct a survey for collecting data
- perform basic data analysis.

Resources to develop and consolidate learning
-
Exploration in data science course
Find out more -
Kaggle: Datasets
Find out more -
Aboriginal and Torres Strait Islander connections to digital technologies
Find out more -
Cyber security card game: know your risks
Find out more -
What's your brand?
Find out more


Years 7–8 Exploration in data science course
Select units and sections from this (US-based) curriculum to introduce both principles and skills for data science. This is a considerably long, US-based sequence of learning intended for high school. Teachers may wish to carefully select relevant units and sections for Australian students in Years 7–8.
Requires
- internet access
- computers, laptops or tablets
- spreadsheet software (e.g. Microsoft Excel, Google Sheets)
Suggested time
12 hoursEnables students to:
- explore a range of data science principles and skills including data collection, analysis, presentation and impact.

Years 7–8 Kaggle: Datasets
Use this website to find datasets for many different topics.
Requires
- internet access
- computers, laptops or tablets
Suggested time
30 minutesEnables students to:
- find and download datasets.

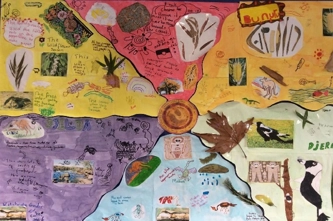
Years 7–8 Aboriginal and Torres Strait Islander connections to digital technologies
Use these ideas to consider the ways of data collection used by Aboriginal and Torres Strait Islander Cultures.
Requires
- access to relevant resources via internet or downloaded resources
Suggested time
1 hourEnables students to:
- explore how Aboriginal and Torres Strait Islander Peoples classify living things based on observable features, functions, and uses
- collect, interpret, and represent data, applying these skills to understand the complex interrelationships of organisms within an environment.

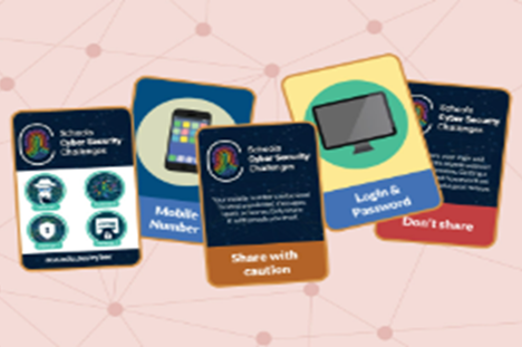
Years 7–8 Cyber security card game: know your risks
Play this card game to discuss what personal information should be shared.
Requires
- printed cards (documents provided)
Suggested time
1 hourEnables students to:
- judge and discuss what kinds of personal data should or should not be shared.
Years 7–8 What's your brand?
Use this lesson from the Office of the eSafety Commissioner to include data privacy as part of cyber safety.
Requires
- internet access
- computers, laptops or tablets, or display to view the resource as a class
- downloadable teaching slides
Suggested time
1 hourEnables students to:
- explore strategies for controlling privacy of their own personal data, through the lens of ‘digital reputation’.

Resources to extend and integrate learning
-
micro:bit Science experiments
Find out more -
CORGIS
Find out more -
generatedata.com
Find out more -
Australian Privacy Principles quick reference
Find out more


Years 7–8 micro:bit Science experiments
Use this series of lessons to practise gathering data from the micro:bit electronic device. This lesson series is not intended as an introduction to coding the micro:bit. See the unit ‘Creating a digital solution’ for options to introduce this device.
Requires
- internet access
- computers, laptops or tablets
- class set of micro:bits
Suggested time
6 hourEnables students to:
- use sensors on the micro:bit to gather data on temperature, soil moisture, gravity and more
- gather the data to another device, including into spreadsheet format.
Years 7–8 CORGIS
Use this site to download datasets in forms that can be readily worked with in Python and other general-purpose programming languages.
Requires
- internet access
- computers, laptops or tablets
Suggested time
30 minutesEnables students to:
- download dataset in the form of Python modules for smart use in Python programming projects
- download datasets in JSON format for use in Python or JavaScript
- download datasets in CSV format for use in spreadsheet software.

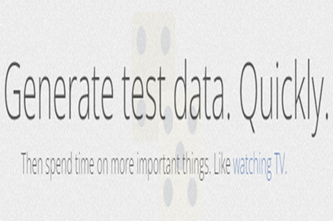
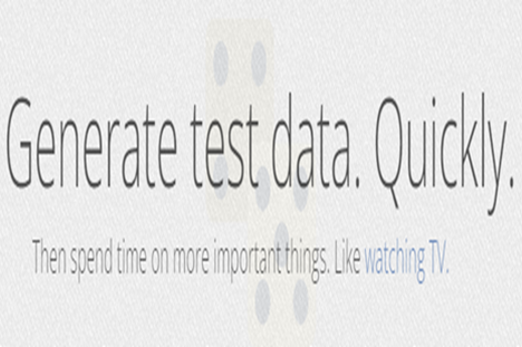
Years 7–8 generatedata.com
Use websites like this to generate test data for use in spreadsheets and databases.
Requires
- internet access
- computers, laptops or tablets
Suggested time
30 minutesEnables students to:
- generate random test data when real-world data is not available
- export this data into a spreadsheet or other forms.
Years 7–8 Australian Privacy Principles quick reference
Quickly look up any of the 13 Australian Privacy Principles, including with a poster.
Requires
- internet access
- computers, laptops or tablets
Suggested time
30 minutesEnables students to:
- look up the principles that outline the responsibilities of organisations in Australia when it comes to collecting using and keeping data.

Further reading and professional learning
-
Data knowledge and skills tutorial - gathering data
Find out more -
Data knowledge and skills tutorial - authenticating data
Find out more -
Australian Data Science Education Institute
Find out more -
Guide to data analytics and the Australian Privacy Principles
Find out more


Years 7–8 Data knowledge and skills tutorial - gathering data
Follow this video tutorial designed for teachers of Years 7–8 students.
Suggested time
12 minutes
Years 7–8 Data knowledge and skills tutorial - authenticating data
Continue from the previous video with this tutorial designed for teachers of Years 7–8 students.
Suggested time
9 minutes
Years 7–8 Australian Data Science Education Institute
Visit and subscribe to this website for resources on teaching data science.
Suggested time
30 minutes
Years 7–8 Guide to data analytics and the Australian Privacy Principles
Refer to official advice provided to organisations by the Office of the Australian Information Commissioner.
Suggested time
30 minutes
Spreadsheets
What is this about?
Spreadsheets are a powerful tool with applications in everyday life as well as study and work. Beyond entering data in a table format, students will apply spreadsheet skills like filtering, formulas and chart creation.
Content descriptions
Analyse and visualise data using a range of software, including spreadsheets and databases, to draw conclusions and make predictions by identifying trends AC9TDI8P02
Model and query the attributes of objects and events using structured data AC9TDI8P03
Investigate and manage the digital footprint existing systems and student solutions collect and assess if the data is essential to their purpose AC9TDI8P14
This sequence enables students to:
- clean a spreadsheet by filtering data that is unnecessary for purpose
- depersonalise a spreadsheet by removing data that unnecessarily contributes to a digital footprint
- apply spreadsheet formulas and other techniques to analyse data
- create charts to visualise data.
Supplementary information
While Microsoft Excel is the most frequently mentioned spreadsheet tool in this unit, other popular software such as Google Sheets and Apple Numbers perform most of the same functions, such as formulas and charts. Consider which software suites are available to students in your school.
The Google Workplace Learning Center provides information about transitioning between Microsoft Excel and Google Sheets.
The Apple Learning Center provides learning materials and a user guide for working with Numbers on an iPad.
Resources to include
Resources to introduce
-
Information is beautiful
Find out more -
Google public data
Find out more -
Solving real-life problems in Excel
Find out more

Years 7–8 Information is beautiful
Explore a collection of interesting and engaging data visualisations.
Requires
- internet access
- computers, laptops or tablets
Suggested time
30 minutesEnables students to:
- be inspired by unique and interesting data visualisations.

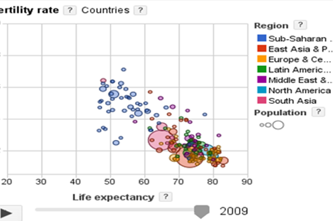
Years 7–8 Google public data
Engage with dynamic data visualisations that display many layers of information.
Requires
- internet access
- computers, laptops or tablets
Suggested time
30 minutesEnables students to:
- try out data visualisations that go beyond 2D charts and line graphs.
Years 7–8 Solving real-life problems in Excel
Use this short video to demonstrate two basic, real-life examples of using formulas in a spreadsheet.
Requires
- internet access
- computers, laptops or tablets to view video
Suggested time
5 minutesEnables students to:
- gain a non-threatening introduction to the use of formulas in a spreadsheet.
Resources to develop and consolidate learning
-
Microsoft Excel activities
Find out more -
Excel Easy
Find out more -
Weather forecast from the stratosphere
Find out more -
Data Analytics
Find out more -
Data Visualisation: finding the mode
Find out more -
Data Visualisation: tips and examples
Find out more -
Modelling data using spreadsheets
Find out more


Years 7–8 Microsoft Excel activities
Use this series of activities and worksheets to introduce and build spreadsheet skills.
Requires
- computers, laptops or tablets
- spreadsheet software (e.g. Microsoft Excel, Google Sheets, Apple Numbers).
Suggested time
5 hoursEnables students to:
- learn core spreadsheet skills through activities and worksheets.

Years 7–8 Excel Easy
Use this series of tutorials to introduce and build spreadsheet skills. View Excel popular topics to learn about different functions.
Requires
- computers, laptops or tablets
- spreadsheet software (e.g. Microsoft Excel, Google Sheets, Apple Numbers).
Suggested time
1-2 hoursEnables students to:
- learn core spreadsheet skills through activities and tutorials.
Years 7–8 Weather forecast from the stratosphere
Use this single lesson to introduce creating a visualisation from a provided dataset in a spreadsheet.
Requires
- computers, laptops or tablets
- spreadsheet software (e.g. Microsoft Excel, Google Sheets, Apple Numbers)
Suggested time
1 hourEnables students to:
- learn core spreadsheet skills needed for creating a chart
- work with a real dataset.
Years 7–8 Data Analytics
Use this online course to introduce principles of working with data.
Requires
- internet access
- computers, laptops or tablets
- free Grok learning accounts
Suggested time
2 hoursEnables students to:
- gain exposure to the use of spreadsheets for solving problems
- learn foundational principles of data analysis.

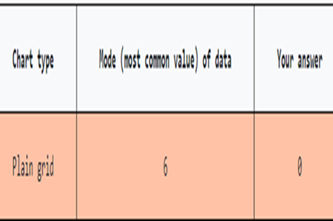
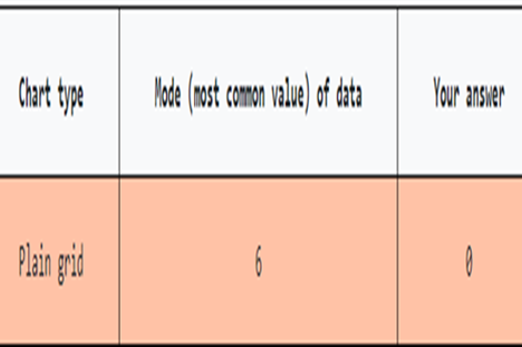
Years 7–8 Data Visualisation: finding the mode
Use this simple game to demonstrate how the choice of visualisation can make it easier to see important information.
Requires
- internet access
- computers, laptops or tablets
Suggested time
15 minutesEnables students to:
- get examples of various main chart types
- be inspired by interesting data visualisations.
Years 7–8 Data Visualisation: tips and examples
Use this webpage to show examples of chart types as well as effective visualisations and infographics.
Requires
- internet access
- computers, laptops or tablets
Suggested time
30 minutesEnables students to:
- get examples of various main chart types
- be inspired by interesting data visualisations.

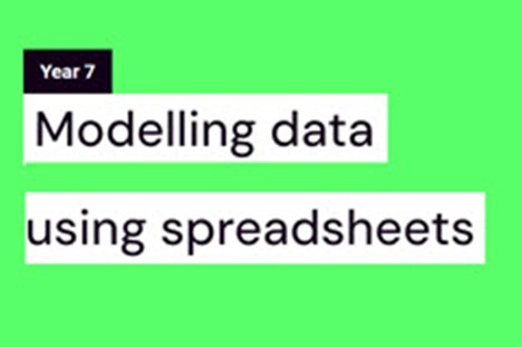
Years 7–8 Modelling data using spreadsheets
Use this online resource to help students to learn spreadsheet skills and analysing data.
Requires
- computers, laptops or tablets
- requires free registration
Suggested time
3-5 hoursEnables students to:
- learn core spreadsheet skills through activities and worksheets.
Resources to extend and integrate learning

Years 7–8 Solar energy installations
Use this lesson to perform analysis on a dataset about solar energy installations. This lesson is not recommended for introducing spreadsheets.
Requires
- computers, laptops or tablets
- spreadsheet software (e.g. Microsoft Excel, Google Sheets, Apple Numbers)
Suggested time
1 hourEnables students to:
- perform an investigation on a real dataset available online
- apply spreadsheet skills to analyse data and create visualisations.

Further reading and professional learning
-
Microsoft Excel
Find out more -
Data knowledge and skills tutorial - authenticating data
Find out more -
Data knowledge and skills tutorial - structuring data in a spreadsheet
Find out more -
Data knowledge and skills tutorial - analysing and visualising data
Find out more -
Microsoft Excel tutorial for beginners
Find out more


Years 7–8 Microsoft Excel
Use the built-in tutorials in Excel (available at the top of the Home screen when you first launch) to learn important skills, e.g. Formula tutorial, PivotTable tutorial.
Suggested time
30 minutes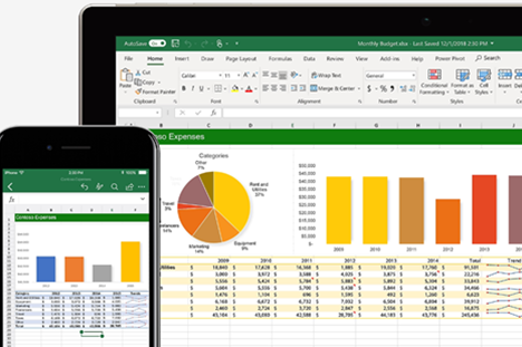
Years 7–8 Data knowledge and skills tutorial - authenticating data
This tutorial designed for teachers of Years 7–8 students.
Suggested time
9 minutes
Years 7–8 Data knowledge and skills tutorial - structuring data in a spreadsheet
This tutorial designed for teachers of Years 7–8 students.
Suggested time
15 minutes
Years 7–8 Data knowledge and skills tutorial - analysing and visualising data
This tutorial designed for teachers of Years 7–8 students.
Suggested time
11 minutes
Years 7–8 Microsoft Excel tutorial for beginners
Use this extensive tutorial video to learn foundational spreadsheet skills.
Suggested time
3 hours
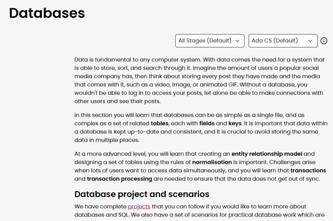
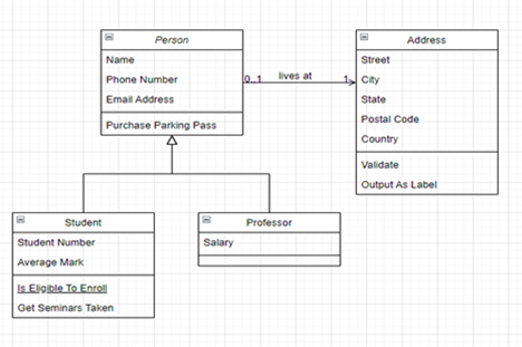
Databases
What is this about?
Databases allow data to be structured in more complex and organised ways than is possible in a flat spreadsheet. Grouping data as attributes within records is the first step in working with databases. Students also make queries to select only data that meets particular criteria, including with Structured Query Language (SQL).
Content description
Analyse and visualise data using a range of software, including spreadsheets and databases, to draw conclusions and make predictions by identifying trends AC9TDI8P02
Model and query the attributes of objects and events using structured data AC9TDI8P03
This sequence enables students to:
- explore the record structure for data
- make queries on a single-table database to select data that meets particular criteria.
Supplementary information
Only single-table databases are addressed in this unit for Years 7–8. This permits understanding of the object/record structure for data, but does not require a thorough demonstration of how relational databases allow more complex organisation of data (see Years 9–10).
Resources to include
Resources to introduce


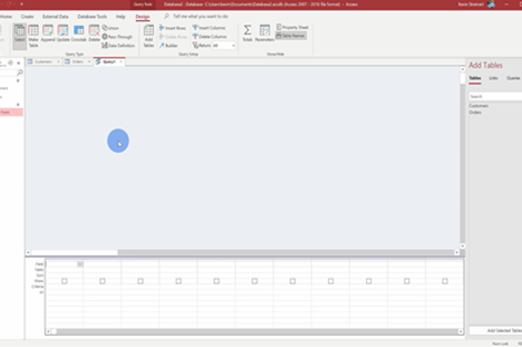
Years 7–8 Database tutorial for beginners
Watch the first 3 minutes of this video to learn why a database is often used instead of a spreadsheet. This video moves on to more complex topics after the first 3 minutes
Requires
- internet access
- computers, laptops or tablets to view video
Suggested time
6 minutesEnables students to:
- receive an introduction to how and why a database is structured differently to a spreadsheet.
Years 7–8 What is SQL?
Watch this short video for a basic intro into SQL, the standard language interacting with databases.
Requires
- internet access
- computers, laptops or tablets to view video
Suggested time
4 minutesEnables students to:
- get a brief introduction to what SQL is, and how it allows data to be requested from a database (as well as added, removed or updated).
Resources to develop and consolidate learning
-
Databases
Find out more -
Databases unplugged
Find out more -
Intro to SQL
Find out more -
The Bike Shop
Find out more -
How to use Microsoft Access
Find out more -
OpenOffice Base
Find out more


Years 7–8 Databases
Use this short Bitesize revision module with test to outline the basic terms and concepts for databases.
Requires
- internet access
- computers, laptops or tablets
Suggested time
30 minutesEnables students to:
- define terms such as record, field, query, form and report
- identify basic database concepts.

Years 7–8 Databases unplugged
Select unplugged activities from this sequence to model database records and SQL queries.
Requires
- variety of classroom stationary
- occasional printouts (document included or linked)
Suggested time
4 hoursEnables students to:
- describe SQL queries from a database.
Years 7–8 Intro to SQL
Use this online course to learn and practise SQL in an auto-marked environment.
Requires
- internet access
- computers, laptops or tablets
- free Grok learning accounts
Suggested time
3 hoursEnables students to:
- learn SQL with an existing, online database
- practice SQL queries in an auto marked environment.

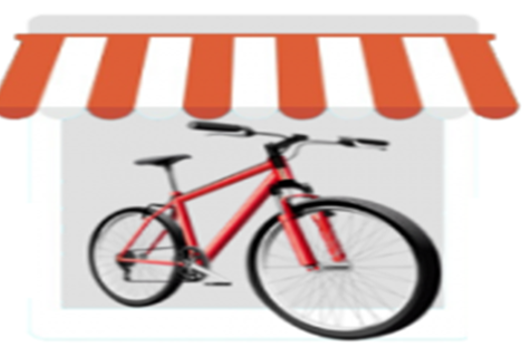
Years 7–8 The Bike Shop
Use this task to practise making SQL queries for a single-table database.
Requires
- internet access
- computers, laptops or tablets
Suggested time
1 hourEnables students to:
- write and test SQL queries for an existing single-table database.
Years 7–8 How to use Microsoft Access
Follow this short but comprehensive video to create a simple database in Microsoft Access. This video also demonstrates table relationships (multiple tables) and cross-table queries, which do not need to be addressed in Years 7–8.
Requires
- Computers or laptops
- installation of Microsoft Access (part of Microsoft Office suites)
Suggested time
31 minutesEnables students to:
- create a database as a single file on their computer or laptop (no remote or local server required)
- practice queries, forms and reports.
Years 7–8 OpenOffice Base
Use this free alternative to Microsoft Access for creating simple databases offline, without setting up servers. OpenOffice Base contains much of the same functionality as Microsoft Access, allowing students to create and manage a database as a single file on their computer or laptop.
Requires
- computers or laptops
- installation of OpenOffice (free alternative to Microsoft Office)
Suggested time
30 minutesEnables students to:
- create a database as a single file on their computer or laptop (no remote or local server required)
- practise queries, forms and reports.
Resources to extend and integrate learning
Years 7–8 Computer Science Principles: Data
Use this unit to work with database data using the AppLab environment, combining programming with data analysis.
Requires
- internet access
- computers, laptops or tablets
- free code.org accounts
Suggested time
9 hoursEnables students to:
- learn data science principles alongside programming skills at their own pace, with a teacher dashboard to monitor progress.
Further reading and professional learning
-
Databases
Find out more -
SQL tutorial on w3schools
Find out more -
Access
Find out more -
Digital Technology
Find out more


Years 7–8 Databases
This comprehensive online guide, provides a background to databases. This topic has information about simple databases and more complex ones that include a set of related tables, each with fields and keys.
Suggested time
30 minutes
Years 7–8 SQL tutorial on w3schools
Use this free resource to quickly look up SQL concepts with straightforward examples.
Suggested time
30 minutes
Years 7–8 Access
Use this free video-driven course to learn how to use Microsoft Access for managing a database offline on your own computer or laptop.
Suggested time
30 minutes
Years 7–8 Digital Technology
This textbook contains chapters on databases.
Suggested time
30 minutes
General-purpose programming
Overview
This unit introduces skills and tools for designing and testing algorithms, building up to the use of nested control structures and functions. Students are also introduced to coding in a general-purpose programming language like Python or JavaScript.
Achievement standards
By the end of Year 8 students design and trace algorithms and implement them in a general-purpose programming language.
Australian Curriculum
Content descriptions
Generating and designing AC9TDI8P05, AC9TDI8P06
Producing and implementing AC9TDI8P09
Related content and General capabilities
Mathematics: Space AC9M7SP04, AC9M8SP04
Digital Literacy: Creating and exchanging, Managing and operating
Critical and Creative Thinking
This topic enables students to
- use flowcharts and pseudocode to follow and design algorithms
- code and test programs in a general-purpose programming language such as Python or JavaScript
- transition from visual programming (e.g. Scratch) to general-purpose programming, if appropriate.
Supplementary information
This unit focuses on building specific skills through concept introduction and exercises in pure code implementation without the use of robots or electronics (though these can also be valid contexts for introducing these skills). The unit ‘Creating a digital solution’ is designed to incorporate skills from this unit into a purposeful design project, with options to explicitly incorporate electronics such as the micro:bit.
Watch this video for a quick overview of the unit and how to use its resources with your students.
Assessment View assessment advice
Achievement standards
Digital Technologies: Years 7-8
By the end of Year 8 students design and trace algorithms and implement them in a general-purpose programming language.
Assessment tasks
Options with a coding platform
Consider whether your chosen coding platform offers additional challenges that you can use for assessment of coding skills, or a ‘playground’ environment for students to complete custom coding challenges you set.
Module/task approach
An entire coding project may be difficult to assess for specific skills. Consider posing specific, smaller tasks of different complexity levels and types. For example, an algorithm (flowchart and/or pseudocode) is provided for some, while others require students to design and/or trace the algorithm first. Some are half-completed code, while others have errors to spot and correct.
A coding rubric
Consider a rubric that allows each skill to be assessed. Try this as a starting point: Word, PDF.
Test question banks
Selected questions from the Secondary question banks may help test student understanding of concepts in algorithms, flowcharts and code implementation.
The Gauntlet of Riddles
An example assessment task for algorithms and implementation, including its own rubrics.
Assessment advice
Use these suggested areas of focus to assess student skills, processes and knowledge.
Interpreting, designing and testing algorithms
Assess levels of complexity and proficiency in:
- interpreting and designing flowcharts and pseudocode
- understanding nested control structures
- tracing algorithms.
Code implementation
Assess levels of complexity and proficiency in:
- coding algorithms that include nested control structures (iteration, branching), variables and input
- writing and calling functions in code
- coding for readability and internal documentation (comments)
- formally testing code.
Unit sequence
This topic offers 2 pathways
Core Unit
Flowcharts and pseudocode
Students design algorithms represented as flowcharts and as pseudocode.Programming in Python
Using Python, students implement algorithms as programs and practise tracing errors.Programming in JavaScript
Using JavaScript, students implement algorithms as programs and practise tracing errors.Flowcharts and pseudocode
What is this about?
Students build and consolidate their knowledge and skills in the design of algorithms represented as flowcharts and as pseudocode. They follow and create algorithms that include nested control structures, and practise tracing to test and predict their algorithms.
Content description
Design algorithms involving nested control structures and represent them using flowcharts and pseudocode AC9TDI8P05
Trace algorithms to predict output for a given input and to identify errors AC9TDI8P06
This sequence enables students to:
- follow and trace algorithms in the form of flowcharts
- follow and trace algorithms in the form of pseudocode
- design algorithms that include nested control structures (loops and branching).
Resources to include
Resources to introduce

Years 7–8 What's an algorithm?
Watch this video to introduce pseudocode.
Requires
- internet access
- computers, laptops or tablets to view video
Suggested time
5 minutesEnables students to:
- explore the concept of an algorithm
- get a first glimpse of pseudocode.

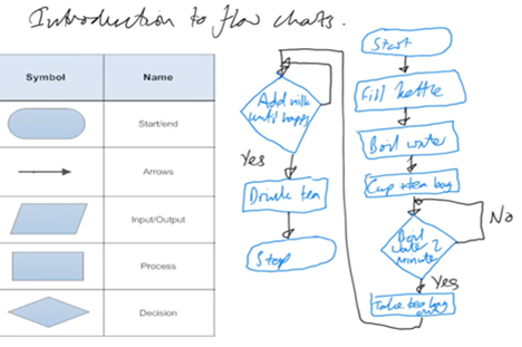
Years 7–8 Introduction to flowcharts
Watch this video and the next in its playlist to introduce flowcharts.
Requires
- internet access
- computers, laptops or tablets to view video
Suggested time
5 minutesEnables students to:
- learn the basic flowchart symbols
- see worked examples of algorithms represented as flowcharts.
Resources to develop and consolidate learning
-
Successful pseudocoding
Find out more -
Algorithm terminology quiz
Find out more -
Trace tables tutorial
Find out more -
Using trace tables
Find out more -
Flowchart prediction tables
Find out more -
draw.io
Find out more
Years 7–8 Successful pseudocoding
Use this lesson sequence to learn pseudocode conventions and perform tracing.
Requires
- printed text (document provided)
Suggested time
6 hoursEnables students to:
- practise writing pseudocode with exercises
- practise tracing algorithms with exercises.

Years 7–8 Algorithm terminology quiz
Practise interpreting pseudocode with this online quiz.
Requires
- internet access
- computers, laptops or tablets
Suggested time
1 hourEnables students to:
- practise following and interpreting pseudocode.
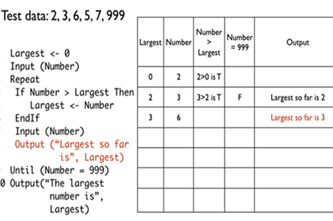
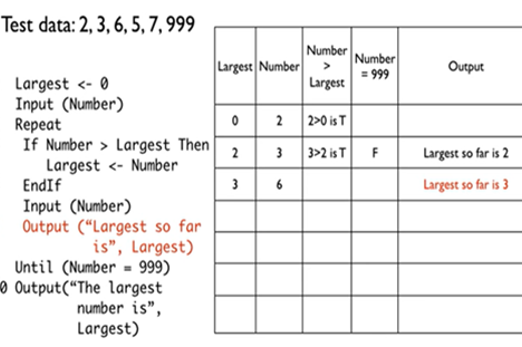
Years 7–8 Trace tables tutorial
Watch this video for an introduction to using a trace table.
Requires
- internet access
- computers, laptops or tablets to view video
Suggested time
6 minutesEnables students to:
- observe a worked example of using a trace table to test a pseudocode algorithm.

Years 7–8 Using trace tables
Practise using trace tables with this online activity. This activity can be followed with code breaking and average night's sleep survey.
Requires
- internet access
- computers, laptops or tablets
Suggested time
1 hourEnables students to:
- practise tracing pseudocode with trace tables.

Years 7–8 Flowchart prediction tables
Practise interpreting flowcharts with these three online exercises. This activity can be followed with code breaking and average night's sleep survey.
Requires
- internet access
- computers, laptops or tablets
Suggested time
1 hourEnables students to:
- practise following and interpreting flowcharts.
Years 7–8 draw.io
Use this free online tool to draw flowcharts, among other diagrams. Common software like Microsoft PowerPoint and Google Slides can also be used to draw flowcharts.
Requires
- internet access
- computers, laptops or tablets
Suggested time
30 minutesEnables students to:
- use standard symbols to draw flowcharts
- common software.
Resources to extend and integrate learning
-
Finding the shortest path
Find out more -
Trace tables - condensed method
Find out more -
Mermaid
Find out more -
Flowgorithm
Find out more -
Bebras
Find out more -
Why algorithms are called algorithms
Find out more


Years 7–8 Finding the shortest path
Use this lesson to introduce students to the famous Travelling Salesman algorithmic problem.
Requires
- internet access
- computers, laptops or tablets
- printed worksheet (document provided)
Suggested time
1 hourEnables students to:
- design algorithms to solve a common problem – finding the shortest path through a series of points.

Years 7–8 Trace tables - condensed method
Watch this video for an example of tracing an algorithm that contains nested control structures.
Requires
- internet access
- computers, laptops or tablets to view video
Suggested time
6 minutesEnables students to:
- observe a worked example of using a trace table to test a pseudocode algorithm that contains branching inside of a loop.
Years 7–8 Mermaid
Use this free online tool to generate flowcharts from text scripts in a straightforward syntax. The scripts used to specify flowcharts in Mermaid are not a general-purpose programming language.
Requires
- internet access
- computers, laptops or tablets
Suggested time
30 minutesEnables students to:
- generate flowcharts using text scripts.
Years 7–8 Flowgorithm
Use this free tool to create flowcharts and automatically show them as pseudocode and real code.
Requires
- Windows computers or laptops
Suggested time
30 minutesEnables students to:
- create flowcharts in a form closer to pseudocode and real code
- view and export their flowcharts as pseudocode, Python or JavaScript, among other languages.
Years 7–8 Bebras
Challenge students with algorithmic thinking tasks designed for Years 7–8.
Requires
- internet access
- computers, laptops or tablets
Suggested time
2 hoursEnables students to:
- complete online or unplugged tasks that require algorithmic thinking
- register and compete in a biannual competition (optional).
Years 7–8 Why algorithms are called algorithms
Watch this video for some historical insight into the man whose name became our word ‘algorithm’.
Requires
- internet access
- computers, laptops or tablets to view video
Suggested time
3 minutesEnables students to:
- enjoy some history about the origin of algorithms.
Further reading and professional learning
-
Programming concepts
Find out more -
Testing
Find out more -
Higher or lower number game
Find out more -
Promoting effective computing pedagogy
Find out more -
Algorithms infographic: Years 7–10
Find out more


Years 7–8 Programming concepts
This comprehensive online guide, provides a background to programming. This topic has information about sequence, selection and variables.
Suggested time
30 minutes
Years 9–10 Testing
This comprehensive online guide, provides a background to testing code. This topic has information on debugging and writing a test plan.
Suggested time
30 minutes
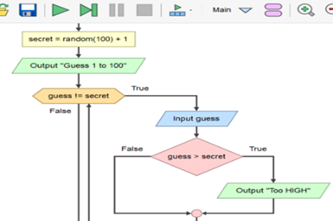
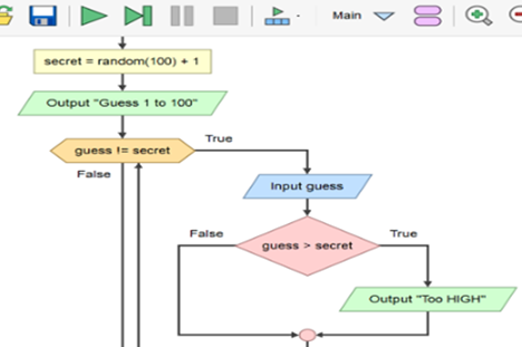
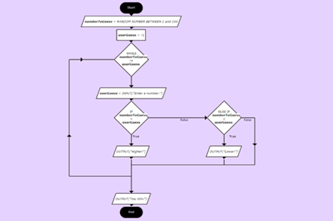
Years 7–8 Higher or lower number game
View the complete flowchart for this game based on a popular search algorithm involving branching nested within a loop. Consider how you might scaffold the construction of this flowchart (or equivalent pseudocode) with your class.
Suggested time
30 minutes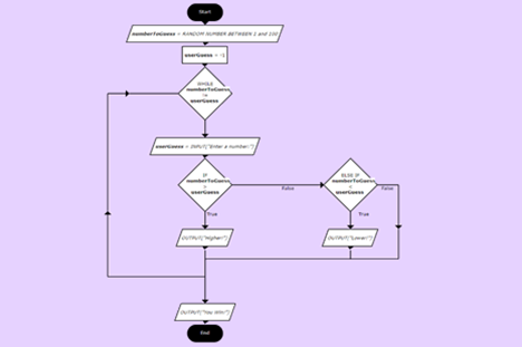
Years 7–8 Promoting effective computing pedagogy
Read useful two-page articles on coding pedagogy, including Code tracing and PRIMM. Podcasts also available.
Suggested time
30 minutes
Years 7–8 Algorithms infographic: Years 7–10
Use this infographic as a guide to view ways algorithms are covered for Years 7–8.
Suggested time
30 minutes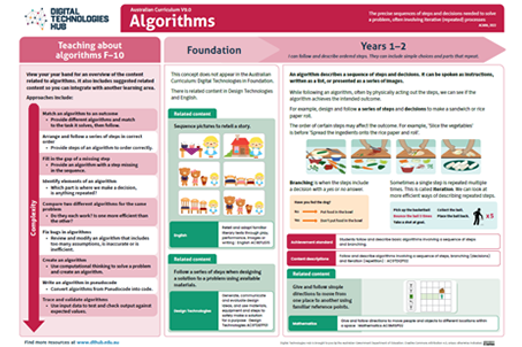
Programming in Python
What is this about?
Python is a popular general-purpose programming language introduced to Years 7–8 students, which emphasises readability of code. Using Python, students can implement algorithms as programs that can be run. Additionally, students can be introduced to the use of functions for organising code.
Content description
Design algorithms involving nested control structures and represent them using flowcharts and pseudocode AC9TDI8P05
Trace algorithms to predict output for a given input and to identify errors AC9TDI8P06
Implement, modify and debug programs involving control structures and functions in a general-purpose programming language AC9TDI8P09
This sequence enables students to:
- learn to write and test code in Python, optionally transitioning from visual code (e.g. Blockly, Scratch)
- understand and practise writing and calling functions in their code.
Resources to include
Resources to introduce

Years 7–8 Python
Learn about Python one of the world’s most popular programming languages to create digital art, interactive maps and models.
Suggested time
1 hour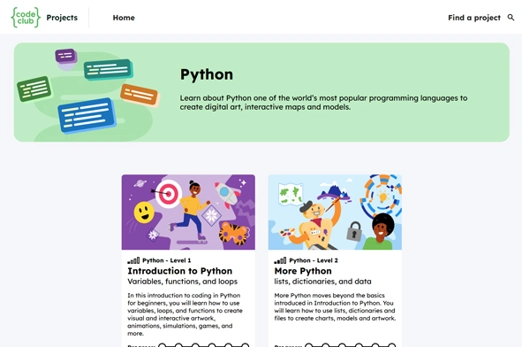
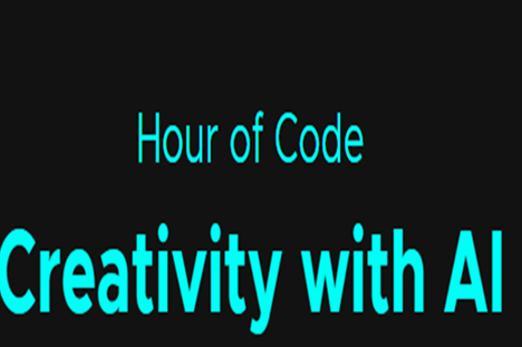
Years 7–8 Hour of code
Search ‘python’ at the linked page and choose a short coding activity or course created for introducing Python. the Hour of Code site brings together free short courses from many different online platforms, but further content on a platform may not be free. Additionally, some may require specific hardware or software installation.
Requires
- internet access
- computers, laptops or tablets
Suggested time
1 hourEnables students to:
- try a short introduction to python programming in a coding environment.
Resources to develop and consolidate learning
-
Visual-to-text coding course
Find out more -
Python for beginners
Find out more -
Introduction to coding
Find out more -
Replit.com
Find out more -
Python Tutor
Find out more -
Thonny
Find out more -
Crack the code - Technology Mandatory
Find out more -
Python language
Find out more


Years 7–8 Visual-to-text coding course
Choose this online lesson series to facilitate a transition from visual code to Python or JavaScript, with an emphasis on algorithm design.
Requires
- internet access
- computers, laptops or tablets
Suggested time
20 hoursEnables students to:
- undertake a series of lessons designed to be run by a teacher
- focus on how visual programs (e.g. Scratch) can be programmed in Python and JavaScript.

Years 7–8 Python for beginners
Choose this online course to provide students with interactive, self-marking coding exercises.
Requires
- internet access
- computers, laptops or tablets
- free Grok learning accounts
Suggested time
12 hoursEnables students to:
- learn Python programming concepts at their own pace, with a teacher dashboard to monitor progress
- complete exercises in an interactive, self-marking coding environment.
Years 7–8 Introduction to coding
Choose this online course to introduce Python through a series of introductory videos and coding exercises. algorithm complexity as expected in the Years 7–8 curriculum, this course should be followed by Intermediate coding.
Requires
- internet access
- computers, laptops or tablets
Suggested time
8-16 hoursEnables students to:
- learn python programming concepts at their own pace, or with teacher direction
- write programs with the help of video walkthroughs.

Years 7–8 Replit.com
Use this online environment to write and test Python programs.
Requires
- internet access
- computers or laptops
- free replit.com accounts (tied to individual email addresses)
Suggested time
30 minutesEnables students to:
- write and test Python code in an online Integrated Development Environment (IDE).
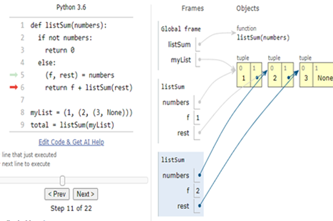
Years 7–8 Python Tutor
Use this online tool to visualise Python code as you run it.
Requires
- internet access
- computers or laptops
Suggested time
30 minutesEnables students to:
- write Python code, then step through line-by-line
- show visualisations of the variables in their code.

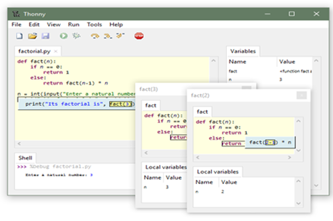
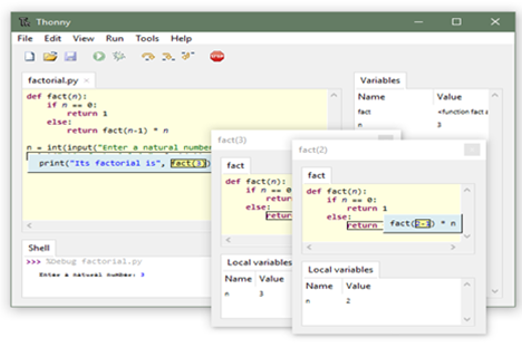
Years 7–8 Thonny
Use this tool for a very basic offline environment to code in Python. Thonny must be installed on Windows, Mac or Linux.
Requires
- computers or laptops
- internet access
Suggested time
30 minutesEnables students to:
- write and test Python code in a simple IDE without relying on online environments
- show visualisations of the variables in their code.
Year 7-8 Crack the code - Technology Mandatory
A unit of work that develops knowledge, skills and understanding of coding
Requires
- computer with internet access
- Arduino boards and sensors
Suggested time
10 hours+Enables students to:
- Implement, modify and debug programs involving control structures and functions in a general-purpose programming language

Years 7–8 Python language
Students develop and implement digital solutions using Python programming language through applying data types and control structures.
Requires
- computer with internet access
- access to Python
Suggested time
10 hours+Enables students to:
- Implement, modify and debug programs involving control structures and functions in a general-purpose programming language

Resources to extend and integrate learning
-
Coding a sentimental chatbot in Python
Find out more -
NCSS challenge Python
Find out more -
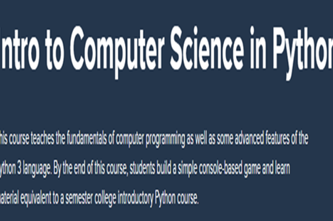
Intro to computer science in Python
Find out more -
Minecraft for Education
Find out more -
Visual Studio Code
Find out more


Years 7–8 Coding a sentimental chatbot in Python
Apply Python coding to build a chatbot that uses natural language processing.
Requires
- internet access
- computers, laptops or tablets
Suggested time
8 hoursEnables students to:
- practice Python coding with the help of demonstration videos
- develop a conversational program that performs sentimental analysis to detect emotion in text.

Years 7–8 NCSS challenge Python
Provide online coding challenges for students during February and July (beginners or intermediate streams).
Requires
- internet access
- computers, laptops or tablets
Suggested time
5 weeksEnables students to:
- practise Python coding with the help of demonstration videos
- develop a conversational program that performs sentiment analysis to detect emotion in text.
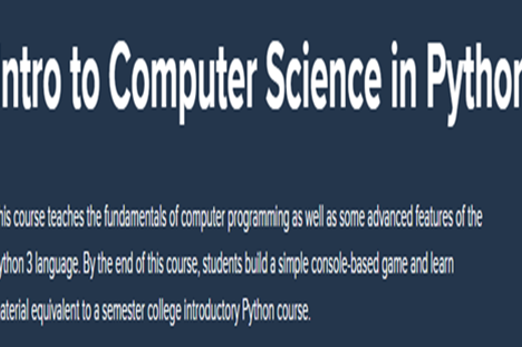
Years 7–8 Intro to computer science in Python
Choose this online platform to customise a sequence of modules for your class.
Requires
- internet access
- computers, laptops or tablets
- free CodeHS accounts
Suggested time
20 hoursEnables students to:
- learn Python programming concepts at their own pace, with a teacher dashboard to monitor progress
- take on more advanced modules with customisation by their teacher.
Years 7–8 Minecraft for Education
Explore Python coding in the Minecraft environment. Minecraft: Education Edition must be installed on Windows, Mac, Chromebook, iOS or Android.
Requires
- internet access
- computers, laptops or tablets
Suggested time
11 hoursEnables students to:
- learn and practise Python coding within a Minecraft environment customised for education.

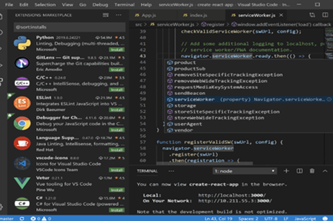
Years 7–8 Visual Studio Code
Use this software for a full-featured offline environment to code in Python. Visual Studio Code must be installed on Windows, Mac or Linux.
Requires
- computers or laptops
Suggested time
30 minutesEnables students to:
- write and test Python code in a full-featured IDE without relying on online environments.
Further reading and professional learning
-
Python courses on Codeacademy
Find out more -
17 fun python activities for beginners
Find out more -
Learn Python on w3schools
Find out more -
Promoting effective computing pedagogy
Find out more -
Programming infographic: Years 7-10
Find out more


Years 7–8 Python courses on Codeacademy
Choose one of the free courses if you prefer a separate, non-school-tailored environment to skill yourself up in Python programming.
Suggested time
30 minutes
Years 7–8 17 fun python activities for beginners
Use this list to get ideas for programming challenges to set your students.
Suggested time
30 minutes
Years 7–8 Learn Python on w3schools
Use this free resource to quickly look up Python concepts with straightforward examples.
Suggested time
30 minutes
Years 7–8 Promoting effective computing pedagogy
Read useful two-page articles on coding pedagogy, including worked examples, live coding and PRIMM. Podcasts also available.
Suggested time
30 minutes
Years 7–8 Programming infographic: Years 7-10
Use this infographic as a guide to view ways programming is covered for Years 7–8.
Suggested time
30 minutes
Programming in JavaScript
What is this about?
JavaScript is a general-purpose programming language that is also used to make webpages interactive. Using JavaScript, students can implement algorithms as programs that can be run. Additionally, students are introduced to the use of functions for organising code.
Content descriptions
Design algorithms involving nested control structures and represent them using flowcharts and pseudocode AC9TDI8P05
Trace algorithms to predict output for a given input and to identify errors AC9TDI8P06
Implement, modify and debug programs involving control structures and functions in a general-purpose programming language AC9TDI8P09
This sequence enables students to:
- learn to write and test code in JavaScript, optionally transitioning from visual code (e.g. Blockly, Scratch)
- understand and practise writing and calling functions in their code.
Resources to include
Resources to introduce

Years 7–8 Hour of code
Search ‘javascript’ at the linked page and choose a short coding activity or course created for introducing JavaScript. the Hour of Code site brings together free short courses from many different online platforms, but further content on a platform may not be free. Additionally, some may require specific hardware or software installation.
Requires
- internet access
- computers, laptops or tablets
Suggested time
1 hourEnables students to:
- try a short introduction to JavaScript programming in a coding environment.
Years 7–8 Geography mini
Try a short course that dives into HTML, CSS and JavaScript with a geography connection.
Requires
- internet access
- computers, laptops or tablets
- free Grok learning accounts
Suggested time
5 hoursEnables students to:
- explore some basic HTML, CSS and JavaScript programming at their own pace, with a teacher dashboard to monitor progress
- complete exercises in an interactive, self-marking coding environment.

Resources to develop and consolidate learning
-
Visual to text coding course
Find out more -
Game lab
Find out more -
Webpages with JavaScript
Find out more -
Replit.com
Find out more -
Python Tutor
Find out more

Years 7–8 Visual to text coding course
Choose this online lesson series to facilitate a transition from visual code to Python or JavaScript, with an emphasis on algorithm design.
Requires
- internet access
- computers, laptops or tablets
Suggested time
20 hoursEnables students to:
- undertake a series of lessons designed to be run by a teacher
- focus on how visual programs (e.g. Scratch) can be programmed in Python and JavaScript.
Years 7–8 Game lab
Choose the unit ‘Animations and games’ from the Computer Science Discoveries course to provide students with interactive coding exercises.
Requires
- internet access
- computers, laptops or tablets
- free code.org accounts
Suggested time
1 hourEnables students to:
- learn JavaScript programming concepts at their own pace, with a teacher
- alternate between typing code and using blocks
- complete exercises in an interactive coding environment.

Years 7–8 Webpages with JavaScript
Choose this online course to work with HTML, CSS and JavaScript, providing students with interactive, self-marking coding exercises. If students are new to HTML, this course should be preceded HTML/CSS starter.
Requires
- internet access
- computers, laptops or tablets
- free Grok learning accounts
Suggested time
10 hoursEnables students to:
- learn JavaScript programming concepts in the context of webpages with HTML and CSS, with a teacher dashboard to monitor progress
- complete exercises in an interactive, self-marking coding environment.

Years 7–8 Replit.com
Use this online environment to write and test JavaScript programs. selecting 'Node.js' when creating a project allows for a direct JavaScript programming experience. Selecting 'HTML, CSS, JS' starts a project with a webpage development experience.
Requires
- internet access
- computers, laptops or tablets
- free replit.com accounts (tied to individual email addresses)
Suggested time
30 minutesEnables students to:
- write and test JavaScript code in an online IDE.
Years 7–8 Python Tutor
Despite the name, use this online tool to visualise JavaScript code as you run it.
Requires
- internet access
- computers or laptops
Suggested time
30 minutesEnables students to:
- write JavaScript code then step through line-by-line
- show visualisations of the variables in their code.
Resources to extend and integrate learning
-
Coding for GUIs course
Find out more -
Rock, paper, scissors, AI!
Find out more -
App lab
Find out more -
CoSpaces Edu
Find out more


Years 7–8 Coding for GUIs course
Continue from the visual-to-text coding course to create interactive webpages with HTML, CSS and JavaScript.
Requires
- internet access
- computers, laptops or tablets
Suggested time
10 hoursEnables students to:
- undertake a series of lessons designed to be run by a teacher
- focus on principles of user interface while using JavaScript code to make webpages interactive.

Years 7–8 Rock, paper, scissors, AI!
Use this guided project to apply JavaScript code for training a computer vision AI model.
Requires
- internet access
- computers, laptops or tablets with webcam
- free P5 accounts (see the resource for info about P5)
Suggested time
3 hoursEnables students to:
- train an AI model to recognise rock, paper and scissors hand gestures
- apply JavaScript code with the trained AI model to develop a rock, paper, scissors game that watches their hand.

Years 7–8 App lab
Choose Units 3 to 7 from the Computer Science Principles course to provide students with interactive coding exercises.
Requires
- internet access
- computers, laptops or tablets
- free code.org accounts
Suggested time
40 hoursEnables students to:
- learn JavaScript programming concepts at their own pace, with a teacher
- alternate between typing code and using blocks
- complete exercises in an interactive coding environment.

Years 7–8 CoSpaces Edu
Create a 3D world to engage with in AR and VR, then use JavaScript code to make it interactive. This environment uses TypeScript, a language that is functionally identical to JavaScript for most Year 7–8 coding requirements.
Requires
- internet access
- computers or laptops
- paid CoSpaces licenses
Suggested time
30 hoursEnables students to:
- construct a 3D environment with objects, furniture and characters
- use JavaScript code to make the world interactive
- with appropriate hardware, enter into your world with Virtual Reality (VR) or Augmented Reality (AR).
Further reading and professional learning
-
JavaScript courses on Codeacademy
Find out more -
JavaScript tutorial on W3Schools
Find out more -
Promoting effective computing pedagogy
Find out more -
Programming infographic: years 7-10
Find out more
Years 7–8 JavaScript courses on Codeacademy
Choose one of the free courses if you prefer a separate, non-school-tailored environment to skill yourself up in JavaScript programming.
Suggested time
30 minutes
Years 7–8 JavaScript tutorial on W3Schools
Use this free resource to quickly look up JavaScript concepts with straightforward examples.
Suggested time
30 minutes
Years 7–8 Promoting effective computing pedagogy
Read useful two-page articles on coding pedagogy, including worked examples, live coding and PRIMM. Podcasts also available.
Suggested time
30 minutes
Years 7–8 Programming infographic: years 7-10
Use this infographic as a guide to view ways programming is covered for Years 7–8.
Suggested time
30 minutes
Hardware, networks and cyber threats
Overview
This unit explores how the performance of computer hardware – such as CPU and RAM – is determined by its specifications, and how digital networks (wired and wireless) can also be compared in terms of requirements. Students are introduced to the concepts of network protocols and cryptography for ensuring data integrity and security, and learn to identify and mitigate cyber security threats like phishing.
Achievement standards
By the end of Year 8 students select appropriate hardware for particular tasks, explain how data is transmitted and secured in networks, and identify cyber security threats.
Australian Curriculum
Content descriptions
Digital systems AC9TDI8K01, AC9TDI8K02
Privacy and security AC9TDI8P13
Related content and General capabilities
Digital Literacy: Managing and operating, Select and operate tools
Critical and Creative Thinking: Generating, Analysing
This topic enables students to
- compare and select different computer hardware according to its performance specifications
- compare physical networks (wired and wireless)
- describe network protocols that ensure data integrity
- explain and apply basic data encryption
- identify cyber security threats like phishing, and measures to mitigate them.
Supplementary information
The four sequences in this unit are designed to be covered in order.
Watch this video for a quick overview of the unit and how to use its resources with your students.
Assessment View assessment advice
Achievement standards
Digital Technologies: Years 7-8
By the end of Year 8 students select appropriate hardware for particular tasks, explain how data is transmitted and secured in networks, and identify cyber security threats.
Present summative assessment rubrics that are tailored to meet the specific learning goals identified for any assessment item. These should be explicit, identify the specific knowledge, understanding and skills that should be demonstrated, and use measurable outcomes and language that students can understand.
The rubric below is not meant to be used as a task rubric. It has been produced to assist you to determine the appropriate level of knowledge and understanding of the key concepts presented in the activities for student achievement at each year level. This should be used alongside the Australian Curriculum achievement standards and any school or jurisdiction guidelines for summative assessment purposes.
Think of the depth of knowledge and understanding as being a continuum. Students who are operating at a relational level, for example, will also be able to demonstrate the multi-structural knowledge acquisition presented.
While teachers could use aspects of the tasks presented for summative assessment, the following activities and projects are suggested as potential assessment tasks that could be used for evaluation of student learning and generation of grades or scores as required by most jurisdictions and governments.
- Students come up with a new game, or extensions to the CS Unplugged Tablets of Stone activity, that inject additional network infrastructure (for example, routers and firewalls) or security measures (for example, encryption and security certificates), and assess them on correctness and quality of representation.
- Students present their research findings through development of a creative asset (for example, infographic, social media awareness video, podcast episode) that can be published to the wider school community.
- Students use their learning from the activities to write a persuasive letter to their local minister, urging investment in infrastructure to support their future in their industry of interest.
| Structure and types of networks | can identify some of the key features of a network, but is unclear on their roles in the system or how data moves between them | understands the route data travels between main components of a network but does not fully understand the purpose of each step; can state different types of networks | can identify important parts of a network and distinguish between them; explains simple reasons for choosing one type of infrastructure over another | can articulate the role of each component in the network and how the entire system is dependent on each performing a specific purpose; can rationalise choice of network infrastructure | understands how decisions around design of networks are affected by multiple factors, and that good designs will incorporate alternative routes for data transmission and redundancy |
| Transmission and structure of data | identifies that networks allow the transmission of data between computers, and that data carries some meaning | can explain that data transmission involves more than just the transfer of information and requires metadata to be able to function | understands the information contained within metadata and can explain how it is used to ensure messages reach their destination | explains the type of information that is stored in metadata and the limitations this introduces in terms of the rate of transfer and the quantity of message data in each packet | draws upon the knowledge they have learned to hypothesise about the nature of data and the challenges inherent in reconstructing it when multiple data streams are being transferred between nodes in a network |
| Network performance | can identify that different types of physical media change network performance | can explain the reasons for different physical media performing differently on a network | can discuss the advantages and disadvantages of using different types of physical media in terms of cost, performance and other factors | can explain why typical networks use a combination of different types of physical media for communication in terms of cost, convenience and other factors | can draw conclusions about the choice of physical media in large networks in terms of both intra- and inter-network communications, and factors such as cost, performance, reliability and convenience |
| Network security basics | understands that modern networks include security features but may not completely understand the need for it | understands the need for security in networks to ensure data is not altered or intercepted by third parties | can explain the need for security in networks in terms of data security and privacy, and can provide a simple description of basic techniques used | understands that network security is achieved through a multi-layered approach, and can explain why more than one layer is necessary for the system to effectively maintain data privacy, security and integrity | can hypothesise about the value of strong security measures to typical online activities such as banking, identity management and other critical services, and the implications of security breaches on society |
| Approximate grade level | E | D | C | B | A |
Unit sequence
This topic offers 4 sequential units
Unit 1
The best computer for the job
Students learn how the specifications of different digital hardware allows components to be selected according to purpose.Unit 2
Networks and protocols
Students compare the performance of physical networks (wired and wireless).Unit 3
Data encryption
Students explore and try out different methods of encryption.Unit 4
Cyber threats
Students learn about cyber threats like phishing and ways to protect digital systems, such as using multi-factor authentication for passwords.The best computer for the job
What is this about?
The best laptop for office work may not be appropriate for professional video editing, or for playing 3D games. Students learn how the specifications of different digital hardware allows components to be selected according to purpose.
Content description
Explain how hardware specifications affect performance and select appropriate hardware for particular tasks and workloads AC9TDI8K01
This sequence enables students to:
- identify specifications for different digital hardware
- select appropriate hardware according to a given purpose or user.
Supplementary information
Digital hardware specifications – such as the most up-to-date CPUs or graphics capabilities on computers and phones – change from year to year. It is recommended to seek current information, such as through computer hardware stores and review articles.
Resources to include
Resources to introduce
-
What does what in your computer?
Find out more -
What's inside a smartphone?
Find out more -
Parts of a wearable computer
Find out more

Years 7–8 What does what in your computer?
Watch this video to introduce the key components of a desktop computer.
Requires
- internet access
- computers, laptops or tablets to view video
Suggested time
8 minutesEnables students to:
- revise or gain an overview of the main components inside a typical desktop computer.
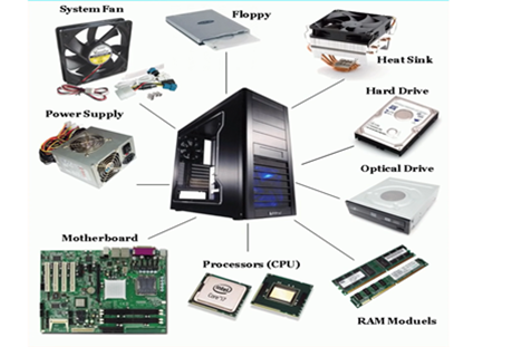
Years 7–8 What's inside a smartphone?
Watch this dissection of a phone and try to identify computer hardware components.
Requires
- internet access
- computers, laptops or tablets to view video
Suggested time
4 minutesEnables students to:
- break down hardware components within a smartphone
- attempt to identify the equivalent components also found in desktop and laptop computers, such as the motherboard, CPU, GPU and memory.

Years 7–8 Parts of a wearable computer
Display this poster to show how even smartwatches have similar components to a computer.
Requires
- internet access
- computers, laptops or tablets to view video
Suggested time
30 minutesEnables students to:
- identify hardware components within a wearable device.
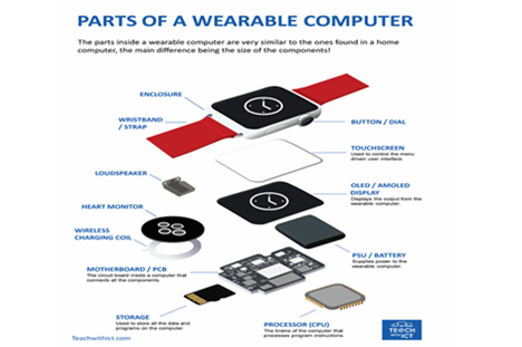
Resources to develop and consolidate learning
-
The 3 Cs – introducing the CPU
Find out more -
Memory (RAM/ROM)
Find out more -
Storage devices
Find out more -
Computer specifications
Find out more -
Hardware contest
Find out more -
Computer hardware crossword
Find out more


Years 7–8 The 3 Cs – introducing the CPU
Use this lesson to focus on three key features when choosing a CPU.
Requires
- slides (provided)
- printed and cut-out keywords (documents provided)
- internet access
- computers, laptops or tablets
Suggested time
1 hourEnables students to:
- focus on the meaning of clock speed, cache size and number of cores in a CPU.

Years 7–8 Memory (RAM/ROM)
Use this lesson to explore how RAM and ROM work.
Requires
- printed posters (documents provided)
- printed and cut-out numbers (documents provided)
- internet access
- computers, laptops or tablets
Suggested time
1 hourEnables students to:
- participate in an unplugged classroom activity to simulate how RAM and ROM interact.

Years 7–8 Storage devices
Use this activity to explore different secondary storage media and choose them to fit purpose.
Requires
- documents for students to complete then print (provided)
Suggested time
1 hourEnables students to:
- research the differences between optical, magnetic and solid state storage
- compare different storage media according to requirements.
Years 7–8 Computer specifications
Use this online lesson with video and quiz to learn about choosing CPUs according to specifications.
Requires
- internet access
- computers, laptops or tablets
Suggested time
1 hourEnables students to:
- explore different CPU types and specifications
- discuss choosing the appropriate CPU for a user's requirements.

Years 7–8 Hardware contest
Use this activity to get students researching and thinking about hardware specifications. The specific hardware referenced in this activity is unlikely to be up-to-date at the time of use. Consider modifying the details before doing this activity. Also, consider framing it around different user requirements rather than a simple ‘which is better’.
Requires
- internet access
- computers, laptops or tablets
Suggested time
1 hourEnables students to:
- compare different computer hardware according to given specifications
- argue for the selection of one device over another according to requirements.
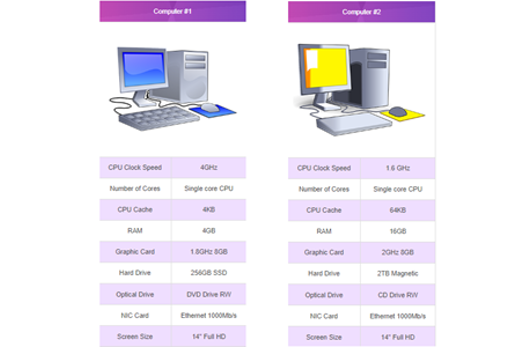
Years 7–8 Computer hardware crossword
Use this online crossword to revise computer hardware vocabulary.
Requires
- internet access
- computers, laptops or tablets
Suggested time
30 minutesEnables students to:
- revise their understanding of different computer hardware terms.

Resources to extend and integrate learning


Years 7–8 Integrated circuits and Moore's Law
Watch this video to delve into the history of silicon chips.
Requires
- internet access
- computers, laptops or tablets to view video
Suggested time
14 minutesEnables students to:
- explore how tiny transistors enabled the computer revolution.
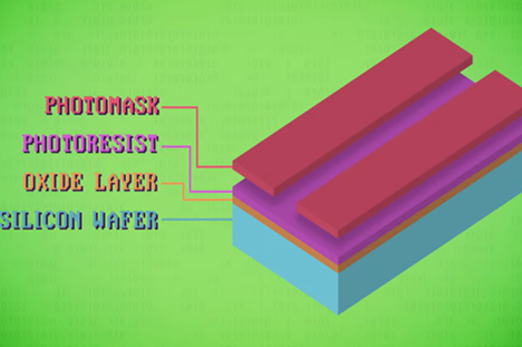
Years 7–8 Quantum computing
Work through this course for an introduction to the new area of quantum computing.
Requires
- internet access
- computers, laptops or tablets
- free Grok learning accounts
Suggested time
2 hoursEnables students to:
- describe the differences between regular computers and quantum computers.

Further reading and professional learning
-
Hardware
Find out more -
Software
Find out more -
Digital Technologies for the Australian Curriculum
Find out more -
Computer specifications lesson demonstration
Find out more -
Hardware
Find out more -
CPU performance
Find out more -
Storage devices
Find out more -
Internal memory
Find out more


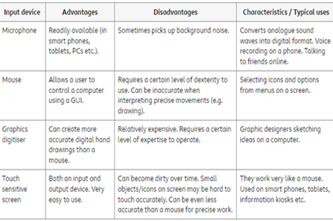
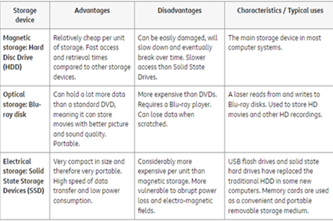
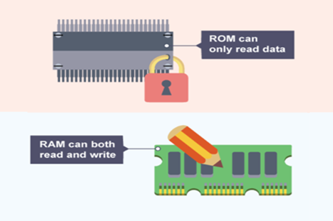
Years 7–8 Hardware
This comprehensive online guide, provides a background to software, the term used to describe the programs that provide the instructions to control the computer hardware components. This topic has information about application software and system software.
Suggested time
30 minutes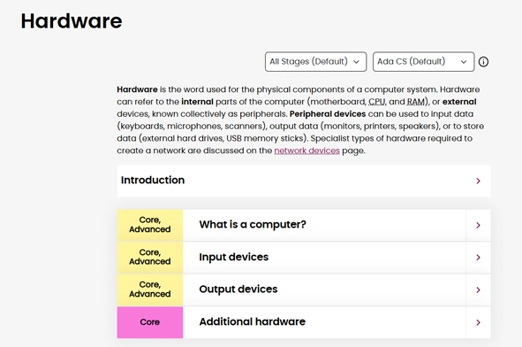
Years 7–8 Software
This comprehensive online guide, provides a background to software, the term used to describe the programs that provide the instructions to control the computer hardware components. This topic has information about application software and system software.
Suggested time
30 minutes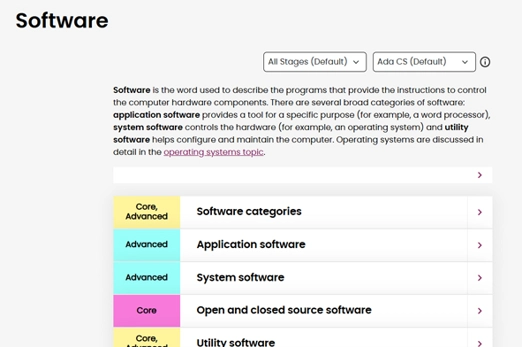
Years 7–8 Digital Technologies for the Australian Curriculum
Use this textbook to ground your knowledge in hardware and network theory.
Suggested time
30 minutes

Years 7–8 Hardware
Use this Bitesize revision module to get facts about CPUs.
Suggested time
30 minutes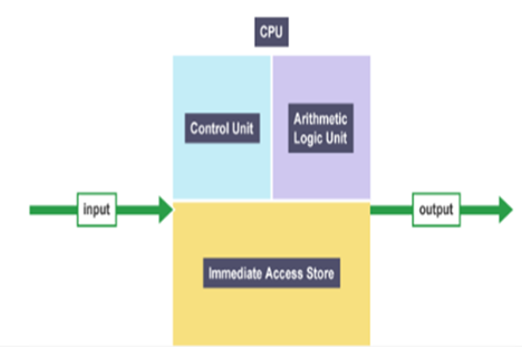
Years 7–8 CPU performance
Use this Bitesize revision module to get facts about CPU performance.
Suggested time
30 minutes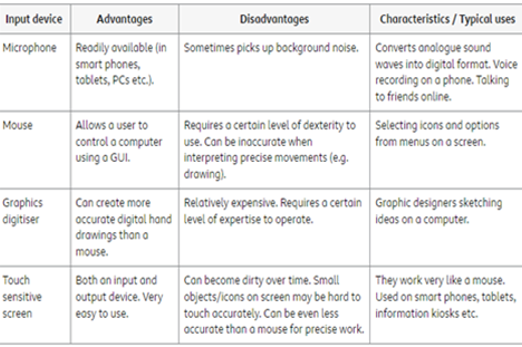
Years 7–8 Storage devices
Use this Bitesize revision module to get facts about secondary storage devices.
Suggested time
30 minutes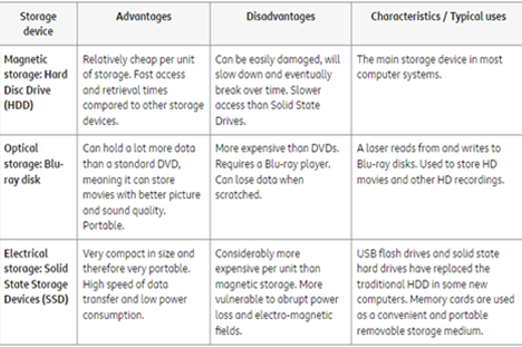
Years 7–8 Internal memory
Use this Bitesize revision module to get facts about RAM and ROM.
Suggested time
30 minutes
Networks and protocols
What is this about?
Just as computer hardware components have pros and cons depending on requirements, the performance of physical networks (wired and wireless) can also be compared. Students also explore network protocols used to ensure data is transmitted correctly from one device to another.
Content description
Investigate how data is transmitted and secured in wired and wireless networks including the internet AC9TDI8K02
This sequence enables students to:
- identify different types of networks and compare their performance
- describe protocols used to ensure data integrity across a network (accurate transmission from one device to another)
- model networks and network protocols using micro:bits (optional).
Resources to include
Resources to introduce
-
The internet: wires, cables and wi-fi
Find out more -
A packet's tale: How does the internet work?
Find out more


Years 7–8 The internet: wires, cables and wi-fi
Watch this video for a brief outline of the three most common transmission media used in networks.
Requires
- internet access
- computers, laptops or tablets to view video
Suggested time
7 minutesEnables students to:
- explore and compare copper cables, optic fibre and wireless transmission.

Years 7–8 A packet's tale: How does the internet work?
Revisit this short video to introduce the concept of packet switching.
Requires
- internet access
- computers, laptops or tablets to view video
Suggested time
3 minutesEnables students to:
- be exposed to the concept of breaking data down into packets for transmission across networks.

Resources to develop and consolidate learning
-
Superhighways used for millennia
Find out more -
Computer networks
Find out more -
Network technologies
Find out more -
Computer Chatter 1: Networks and data transmission
Find out more -
Computer Chatter 2: Network performance
Find out more -
Networks from semaphores to the internet
Find out more -
The internet course unit
Find out more -
Network design drag & drop
Find out more -
Australia's internet technologies compared for you
Find out more -
Network Design
Find out more

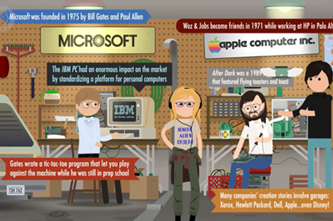

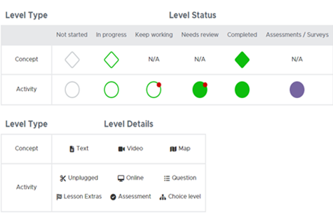

Years 7–8 Superhighways used for millennia
Use this lesson, to guide students to compare physical networks (wired and wireless) to the ancient network related to First Nations Peoples’ trading practices throughout history, including trade routes.
Requires
- computer and internet access to view videos
- access to worksheets (documents provided)
Suggested time
2 hoursEnables students to:
- compare and contrast computer networks and ancient First Nations trade routes
- describe possible ways the ancient trade routes might be similar to network components.

Years 7–8 Computer networks
Watch this video for a condensed introduction to network terminology and the concept of packet switching.
Requires
- internet access
- computers, laptops or tablets
Suggested time
12 minutesEnables students to:
- explore the history of computer networks and the internet
- gain a quick introduction to the concept of packet switching.

Years 7–8 Network technologies
Use this Bitesize module with video to compare network topologies.
Requires
- internet access
- computers, laptops or tablets
Suggested time
3 minutesEnables students to:
- compare and contrast star, ring and bus network topologies.
Years 7–8 Computer Chatter 1: Networks and data transmission
Use this unplugged lesson to introduce students to the challenges of transmitting messages in a network.
Requires
- printed transport maps (example links provided)
- printed, cut-out pieces of paper (documents provided)
Suggested time
1 hourEnables students to:
- practise determining routes through a network
- role-play network protocols using pieces of paper in the classroom.
Years 7–8 Computer Chatter 2: Network performance
Use this research activity to explore and discuss the differing performances of various network solutions.
Requires
- internet access
- computers, laptops or tablets
Suggested time
1 hourEnables students to:
- research different network infrastructures
- consider the suitability and performance of different network solutions.

Years 7–8 Networks from semaphores to the internet
Choose this lesson series to cover network hardware, protocols and metrics for performance.
Requires
- various worksheets and slide packs (included)
- internet access
- computers, laptops or tablets
- requires free login to access downloadable materials
Suggested time
6 hoursEnables students to:
- define network hardware
- compare wired and wireless networks using metrics such as bandwidth
- introduce internet protocols.
Years 7–8 The internet course unit
Choose this lesson series to introduce key concepts about the internet while using a network simulation tool.
Requires
- internet access
- computers, laptops or tablets
- free code.org accounts
Suggested time
6 hoursEnables students to:
- explore network addresses and their purpose
- explore routers and their use in directing network traffic
- collaboratively simulate network hardware, traffic and protocols.
Years 7–8 Network design drag & drop
Use this activity to identify common network components and describe their purpose.
Requires
- internet access
- computers, laptops or tablets
Suggested time
30 minutesEnables students to:
- identify components such as switches, workstations and firewalls
- describe the purposes of common network components.

Years 7–8 Australia's internet technologies compared for you
Use this 2021 article to discuss and compare the options for accessing internet in Australia.
Requires
- internet access
- computers, laptops or tablets
Suggested time
30 minutesEnables students to:
- compare the different options for internet connectivity in Australia.

Years 7–8 Network Design
Use this student-friendly tool to design a network.
Requires
- internet access
- computers, laptops or tablets
Suggested time
1 hourEnables students to:
- identify network components
- construct a network diagram.

Resources to extend and integrate learning
-
Morse code network
Find out more -
How to read a traceroute
Find out more -
The story of wi-fi
Find out more -
Python networking with micro:bit
Find out more -
Networking with the micro:bit
Find out more
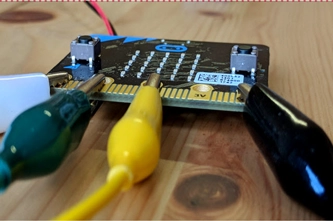


Years 7–8 Morse code network
Choose this hands-on course to model networks and network protocols by wiring together micro:bits.
Requires
- class set of micro:bits (one per student or pair)
- internet access
- computers, laptops or tablets
Suggested time
5 hoursEnables students to:
- code and physically wire together micro:bits to model a network using Morse Code as a metaphor
- gain a basic understanding of hubs and routers.

Years 7–8 How to read a traceroute
Demonstrate this functionality to reveal the different routers a packet passes through. some school networks do not allow traceroute to function.
Requires
- internet access
Suggested time
15 minutesEnables students to:
- see the different routers a packet passes through, e.g. when you attempt to connect to an overseas-hosted website.

Years 7–8 The story of wi-fi
Watch this video to introduce the Australian invention of wi-fi.
Requires
- internet access
- computers, laptops or tablets to view video
Suggested time
2 minutesEnables students to:
- get an overview of how text, images and sound are stored in binary.

Years 7–8 Python networking with micro:bit
Learn how to code the micro:bit to use the radio! In this DT Mini Challenge, you can create wireless networks to send pictures and messages around the room!
Requires
- internet access
- computers, laptops or tablets
- free Grok Academy accounts
Suggested time
4–8 hoursEnables students to:
- code and physically wire together micro:bits to model a network.

Years 7–8 Networking with the micro:bit
Choose this hands-on course to explore networks and network protocols with the micro:bit's wireless messaging capability. Student experience using and coding with micro:bits is highly recommended.
Requires
- class set of micro:bits (one per student or pair)
- internet access
- computers, laptops or tablets
Suggested time
7 hoursEnables students to:
- code and physically wire together micro:bits to model a network using Morse Code as a metaphor
- gain a basic understanding of hubs and routers.
Further reading and professional learning
-
The internet
Find out more -
Network fundamentals
Find out more -
Digital Technologies for the Australian Curriculum
Find out more -
What is a computer network?
Find out more -
Australian internet activity report
Find out more


Years 7–8 The internet
This comprehensive online guide, provides a background to the fundamentals of the internet. This topic has information about IP addresses, Domain Name System (DNS) and the common set of protocols referred to as the TCP/IP stack.
Suggested time
30 minutes
Years 7–8 Network fundamentals
This comprehensive online guide, provides a background to the fundamentals of a network. Network standards and protocols allow a wide range of devices from different manufacturers to communicate with each other.
Suggested time
30 minutes
Years 7–8 Digital Technologies for the Australian Curriculum
Use this textbook to ground your knowledge in hardware and network theory.
Suggested time
30 minutes
Years 7–8 What is a computer network?
Read this article for a very simple introduction to some network concepts.
Suggested time
30 minutes
Years 7–8 Australian internet activity report
Use this 2024 report from the ACCC for some insights into internet usage by Australian households.
Suggested time
30 minutes
Data encryption
What is this about?
Encryption is one way of protecting data so that it can be transmitted securely across a network. Students can explore and try out different encryption methods.
Content description
Investigate how data is transmitted and secured in wired and wireless networks including the internet AC9TDI8K02
This sequence enables students to:
- explain the rationale of cyber security
- identify and apply data encryption and decryption.
Resources to include
Resources to introduce
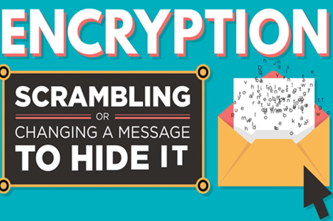

Years 7–8 The internet: Encryption & public keys
Watch this video for a crisp, clear introduction to encryption and the concept of public and private keys.
Requires
- internet access
- computers, laptops or tablets to view video
Suggested time
7 minutesEnables students to:
- explore simple encryption techniques
- understand the need for more complex encryption today
- gain an introduction to public and private keys.
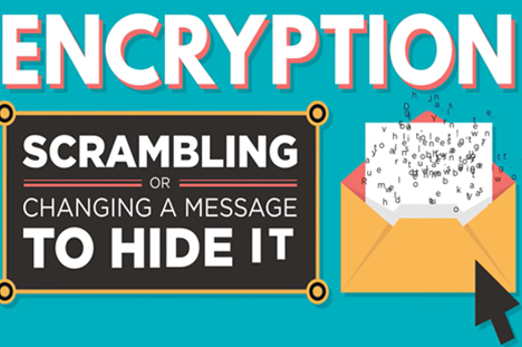
Years 7–8 Cryptography: cipher wheels
Try basic encryption with short, unplugged activities.
Requires
- printed wheel page (document included)
- scissors, butterfly pins
Suggested time
30 minutesEnables students to:
- practise basic encryption and decryption ciphers.

Resources to develop and consolidate learning
-
Simple encryption
Find out more -
Cryptography
Find out more -
Frequency analysis
Find out more -
Enigma emulator
Find out more

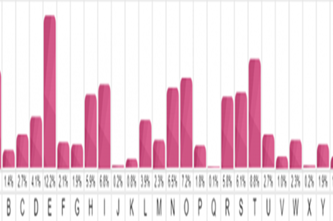
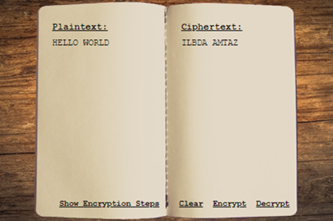
Years 7–8 Simple encryption
Use this online lesson with interactives to try out encryption and decryption.
Requires
- internet access
- computers, laptops or tablets
- free code.org accounts
Suggested time
1 hoursEnables students to:
- practice performing encryption and decryption using a custom, online tool.
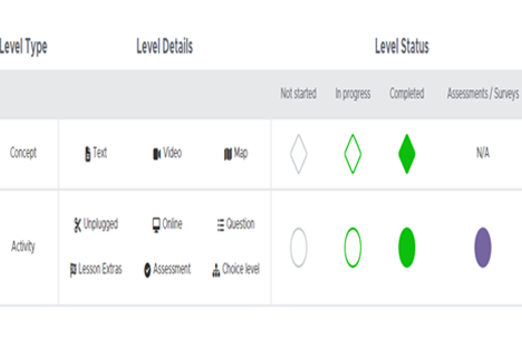
Years 7–8 Cryptography
Use this online course to explore classic cryptographic ciphers and how to break them.
Requires
- internet access
- computers, laptops or tablets
- free Grok learning accounts
Suggested time
6 hoursEnables students to:
- explore and practise encryption and decryption
- learn about cyber security careers.

Years 7–8 Frequency analysis
Use this activity to introduce this technique for decrypting textual ciphers.
Requires
- internet access
- computers, laptops or tablets
Suggested time
1 hourEnables students to:
- learn and practise an established technique for cracking encrypted messages.
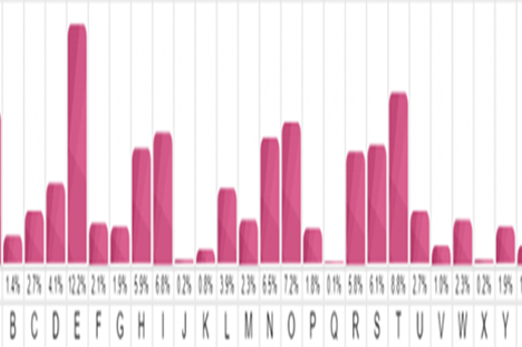
Years 7–8 Enigma emulator
Try an emulator of the famous Enigma device that was cracked during WWII.
Requires
- internet access
- computers, laptops or tablets
Suggested time
1 hourEnables students to:
- learn about the historical encoding device famously cracked in WWII
- use a working emulator to practise encrypting and decrypting messages.
Resources to extend and integrate learning
-
Parachute secret message encoder
Find out more -
Visual cryptography
Find out more -
Cryptography challenge
Find out more

Years 7–8 Parachute secret message encoder
Practise a unique encoding and decoding system based on the NASA Perseverance's parachute.
Requires
- internet access
- computers, laptops or tablets
Suggested time
1 hourEnables students to:
- learn and practise a different type of encryption similar to a barcode.

Years 7–8 Visual cryptography
Use this resource to explain visual cryptography a technique that consists of hiding information (text/symbols/graphics) within two semi-transparent pictures (called layers).
Requires
- internet access
- computers, laptops or tablets
Suggested time
1 hourEnables students to:
- learn and practise a 2D visual technique for encoding messages, similar to that used in QR codes.

Years 7–8 Cryptography challenge
Use this programming activity to provide a challenge for students already familiar with Python. Not recommended for introducing Python coding for the first time. See ‘General-purpose programming’ unit.
Requires
- internet access
- computers, laptops or tablets
Suggested time
2 hoursEnables students to:
- use Python code to reverse-engineer an encryption algorithm.

Further reading and professional learning

Years 7–8 Encryption
Read this online textbook chapter for student-appropriate key information on encryption, including some interactives.
Suggested time
30 minutes
Cyber threats
What is this about?
Students explore how digital systems (including their own) face various cyber threats, such as phishing, and how these threats can be mitigated through techniques including multi-factor authentication of passwords.
Content description
Explain how multi-factor authentication protects an account when the password is compromised and identify phishing and other cyber security threats AC9TDI8P13
This sequence enables students to:
- identify some common cyber security threats, such as phishing
- describe some common approaches for mitigating threats, including multi-factor authentication.
Resources to include
Resources to introduce
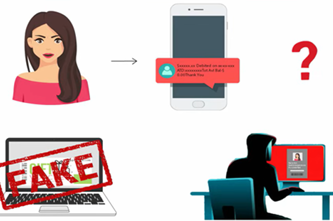
Years 7–8 Cybersecurity in 7 minutes
Watch this video for a brief introduction to common cyber threats and mitigations.
Requires
- internet access
- computers, laptops or tablets to view video
Suggested time
7 minutesEnables students to:
- gain an introduction to cyber threats, including malware, phishing, denial of service attacks and manipulator-in-the-middle attacks.
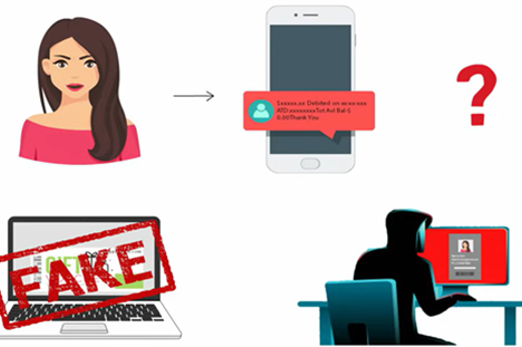
Resources to develop and consolidate learning
-
Information privacy and security course
Find out more -
Security Risks
Find out more -
Protecting Data
Find out more -
Classroom ideas – privacy and security
Find out more -
Cyber hunt
Find out more -
REDSPICE
Find out more -
Cyber Expert (Ages 13-18)
Find out more


Years 7–8 Information privacy and security course
Use this online course to introduce cyber threats with simulated social media and email scenarios.
Requires
- internet access
- computers, laptops or tablets
- free Grok learning accounts
Suggested time
4 hoursEnables students to:
- discover cyber security vulnerabilities among students in a simulated environment
- identify threats like phishing and mitigations like multi-factor authentication.

Years 7–8 Security Risks
Use Lesson 6 and the following Lesson 7 to go over common security risks and examine a case study.
Requires
- internet access
- computers, laptops or tablets
- free code.org accounts
Suggested time
1 hourEnables students to:
- identify and describe keylogging, phishing and malware threats
- investigate a large-scale cyber attack through a case study.

Years 7–8 Protecting Data
Use this lesson to introduce multi-factor authentication as a way to mitigate cyber threats.
Requires
- internet access
- computers, laptops or tablets
- free code.org accounts
Suggested time
1 hourEnables students to:
- explain the purpose and effectiveness of multi-factor authentication.

Years 7–8 Classroom ideas – privacy and security
Use Lesson 1 in this pack to explore multi-factor authentication and biometrics.
Requires
- internet access
- computers, laptops or tablets
Suggested time
3 hoursEnables students to:
- compare different methods of securing passwords
- identify the benefits of multi-factor authentication.

Years 7–8 Cyber hunt
Select short standalone activities recommended for Years 7–8.
Requires
- internet access
- computers, laptops or tablets
Suggested time
5-15 minutes per activityEnables students to:
- warm up at the start of lessons
- explore vulnerabilities that relate to privacy and cyber security.

Years 7–8 REDSPICE
Read about the Australian Government's large-scale initiative to boost national cyber security.
Requires
- internet access
- computers, laptops or tablets
Suggested time
30 minutesEnables students to:
- be informed about the current initiative to boost national cyber security, announced in 2022.

Years 7–8 Cyber Expert (Ages 13-18)
Explore Minecraft's Education Cyber Expert worlds to learn about cybersecurity and build digital fluency.
Requires
- computer with internet access
- access to Minecraft application
Suggested time
2 hours+Enables students to:
- explain how multi-factor authentication protects an account when the password is compromised
- identify phishing and other cyber security threats

Resources to extend and integrate learning

Years 7–8 Cyber security
Use this online course to focus on the ways websites are protected from cyber threats.
Requires
- internet access
- computers, laptops or tablets
- free Grok learning accounts
Suggested time
6 hoursEnables students to:
- identify and mitigate threats to web sites and services, using a simulated web browser environment.

Further reading and professional learning
-
Malicious software
Find out more -
Computer security
Find out more -
Privacy and security infographic (F-10)
Find out more


Years 7–8 Malicious software
This comprehensive online guide, provides a background to malware. Malicious software (malware) is created with the intent to cause damage to computer systems or steal data, and computer users must take steps to lessen these threats.
Suggested time
30 minutes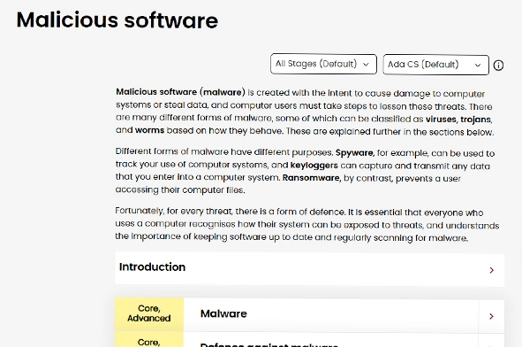
Years 7–8 Computer security
Read this online textbook chapter for student-appropriate key information on cyber threats.
Suggested time
30 minutes
Years 7–8 Privacy and security infographic (F-10)
Explore privacy and security for your Year band.
Suggested time
30 mins
Collaborative data project
Overview
This unit provides an opportunity for students to apply the data-analysis skills from the ‘Working with data’ unit in the context of a digital solution designed, developed and evaluated collaboratively. Project management principles and skills are explicitly introduced in pathway 1, then three different option pathways provide contexts and ideas for student projects that involve the collection and analysis of data and the presentation of information. Choose one pathway that suits your students’ needs, school context and available resources.
Achievement standards
By the end of Year 8 students develop and modify creative digital solutions, decompose real-world problems, and evaluate alternative solutions against user stories and design criteria.
Students acquire, interpret and model data with spreadsheets and represent data with integers and binary.
They select and use a range of digital tools efficiently and responsibly to create, locate and share content; and to plan, collaborate on and manage projects.
Australian Curriculum
Content descriptions
Investigating and defining AC9TDI8P04
Generating and designing AC9TDI8P08
Evaluating AC9TDI8P10
Collaborating and managing AC9TDI8P11, AC9TDI8P12
Related content and General Capabilities
Mathematics: Statistics AC9M7ST03, AC9M8ST01, AC9M8ST04
Digital Literacy: Practising digital safety and wellbeing, Investigating, Managing and operating
Critical and Creative Thinking
Personal and Social capability: Social management
This topic enables students to
- explore agile project management and use digital tools to manage a collaborative project
- refamiliarise themselves with a design methodology, and use it to guide their project
- design a data investigation using user stories and design criteria
- apply the data acquisition and analysis skills from the ‘Working with data’ unit, considering data privacy
- use digital tools to present their information
- evaluate their data investigation.
Supplementary information
This unit is intended to be undertaken after the ‘Working with data’ unit, which introduces data collection principles and specific spreadsheet skills. Additionally, design methodology and user stories are not explicitly reintroduced here – see the ‘Creating a digital solution’ unit for resources on those topics.
The first two option pathways in this unit provide different data collection options for projects where students work in teams to design, perform and evaluate a data investigation. Both options include collection, analysis and visualisation of data with the final presentation produced in the form of an infographic.
- The pathway ‘Primary and secondary data investigation’ focuses on collecting data through a digital survey as well as from an online repository.
- The pathway ‘Analysing sensor data’ focuses on obtaining data from electronic sensors using the popular micro:bit classroom device or other options available in your school. It may include a small amount of programming.
The third option pathway 'Machine learning research' provides a more open-ended opportunity with students conducting research on an artificial intelligence (AI) tool such as Google Teachable Machine.
Watch this video for a quick overview of the unit and how to use its resources with your students.
Assessment View assessment advice
Achievement standards
Digital Technologies: Years 7–8
By the end of Year 8 students develop and modify creative digital solutions, decompose real-world problems, and evaluate alternative solutions against user stories and design criteria.
Students acquire, interpret and model data with spreadsheets and represent data with integers and binary.
They select and use a range of digital tools efficiently and responsibly to create, locate and share content; and to plan, collaborate on and manage projects.
Rubric: Collaborative data project
| Decomposing real-world problems and contexts | with guidance and support breaks down problems into smaller, manageable parts and with prompting can identify project requirements | uses basic skills in decomposing problems and identifies key project requirements | effectively decomposes problems into manageable parts and identifies key project requirements such as data and identifies relationships that highlight the connections between different parts of the project | effectively decomposes problems into manageable parts and identifies all project requirements including the necessary data and describes how interrelationships between different parts of the project can impact the outcome |
| Acquire, store, and validate data from a range of sources using software | with guidance and support acquires and stores data from sources and may not validate data effectively | shows basic skills to acquire and store data from sources; attempts to validate data with some success | demonstrates accessing relevant data sources, imports and clean data, store data in an organised way ensuring that the data is accurate, reliable, and ready for analysis | demonstrates ability to acquire, store, and validate data from diverse sources using appropriate software, demonstrating thorough validation techniques and error checking |
| Analyse and visualise data using a range of software | with guidance and support can analyse and visualise data; demonstrates basic understanding of software tools for analysis and visualisation | demonstrates basic ability to analyse and visualise data; uses software tools for analysis and visualisation with some support | demonstrates analysis and visualisation of data using relevant software; demonstrates understanding of software tools and explains ways to analyse and visualise data effectively | use advanced analysis techniques to derive deep insights from the data and creates complex and interactive visualisations that effectively communicate insights from the data, using advanced features of the software to enhance visual representation |
| Draw conclusions and make predictions by identifying trends | with guidance and support draws conclusions and makes predictions from data; requires support and prompting to identify trends | demonstrates a basic ability to draw conclusions and make predictions from data; identifies trends with some accuracy | draws well considered conclusions referring to relevant data, makes logical predictions from data and identifies trends accurately | draws well-considered conclusions based on relevant data and the question being addressed, makes logical predictions using advanced statistical techniques and identifies complex trends and patterns in the data |
| Planning, collaborating on, and managing projects | with guidance and support, can plan a project with a timeline, work in a team given a specific role and track project progress | plans a project with goals and timelines, works in a team taking on a specific role and tracks project progress using basic project management skills | effectively plans a project with realistic goals and timelines, works effectively in a team collaborating and communicating and effectively tracks project progress using well-developed project management skills | effectively plans a project with realistic goals and timelines, consistently works effectively in a team demonstrating leadership and effectively monitors project progress and if needed adapts the work to achieve the goals and timelines |
Unit sequence
This topic offers 3 pathways
Core Unit
Project management
Students explore agile approaches to project management, as well as digital tools to share, plan and manage work collaboratively.Primary and secondary data investigation
Using agile project management, students work in teams to conduct a data investigation for a specific audience.Analysing sensor data
Using agile project management, students work in teams to conduct a data investigation where the data comes from electronic sensors.Machine learning research
Using agile project management, students work in teams to conduct an investigation into an AI tool such as Google Teachable Machine.Project management
What is this about?
Large endeavours benefit from the effective use of project management techniques, whether individual or collaborative. Students explore agile approaches to project management, as well as digital tools to share, plan and manage work collaboratively.
Although it is associated with a number of specific tools and practices, 'agile' is the name given to a set of values and principles for creating a solution. This approach was developed as a response to the shortcomings of more traditional approaches for software development, such as 'waterfall'.
Content description
Investigating and defining AC9TDI8P04
Generating and designing AC9TDI8P08
Evaluating AC9TDI8P10
Collaborating and managing AC9TDI8P11, AC9TDI8P12
This sequence enables students to:
- explore agile project management and use digital tools to manage a collaborative project
- refamiliarise themselves with a design methodology, and use it to guide their project
- design a data investigation using user stories and design criteria
- apply the data acquisition and analysis skills from the ‘Working with data’ unit, considering data privacy
- use digital tools to present their information.
Supplementary information
While resources for Gantt charts are included, Gantt charts are more associated with traditional project management than with agile methodologies.
Resources to include
Resources to introduce


Years 7–8 What is agile?
Watch this video for a brief introduction to how agile principles and tools differ from the traditional ‘waterfall’ approach to creating a solution.
Requires
- internet access
- computers, laptops or tablets and to view
Suggested time
9 minutesEnables students to:
- gain an introductory understanding of the agile principles
- contrast agile with a traditional 'waterfall' approach to creating a solution.

Years 7–8 Agile manifesto poster
Show this image to reference the four values and 12 principles of the agile approach.
Requires
- internet access
- computers, laptops or tablets and to view or download poster
Suggested time
30 minutesEnables students to:
- view and reference the four values and 12 principles of the agile approach to creating a solution.

Resources to develop and consolidate learning
-
Agile user stories
Find out more -
Scrum vs Kanban - What's the difference?
Find out more -
Trello
Find out more -
Microsoft Whiteboard
Find out more -
How to put a man on the moon if you're a kid
Find out more -
Gantt Project
Find out more -
Microsoft Project
Find out more


Years 7–8 Agile user stories
Watch this video to see example user stories and how user stories apply to agile project management.
Requires
- internet access
- computers, laptops or tablets to view video
Suggested time
7 minutesEnables students to:
- see examples of user stories in the context of software development, but applicable to data investigations - another digital solution
- explore how user stories apply to agile project management.
Years 7–8 Scrum vs Kanban - What's the difference?
Watch this video for an introduction to project management with Scrum and Kanban – two methodologies common to the agile approach.
Requires
- internet access
- computers, laptops or tablets to view video
Suggested time
5 minutesEnables students to:
- gain an introduction to how development teams use the Scrum methodology to complete projects
- explore how the Kanban methodology differs from Scrum.
Years 7–8 Trello
Use this online collaborative tool to manage a board of tasks as part of an agile methodology like Scrum.
Requires
- internet access
- computers, laptops or tablets
- free Trello account for user the board (using email address)
Suggested time
1 hourEnables students to:
- create and maintain a board with individual tasks (tickets)
- use a Scrum template to begin working with that agile methodology.
Years 7–8 Microsoft Whiteboard
For schools with Microsoft suite, Use this collaborative tool for a whiteboard where planning and brainstorming can take place. Microsoft Whiteboard may be available to your school as part of a Microsoft suite.
Requires
- computers or laptops
Suggested time
30 minutesEnables students to:
- work together on a digital whiteboard to make diagrams, plans and brainstorms.

Years 7–8 How to put a man on the moon if you're a kid
Work through this book for a loose question-and-answer approach to applied project management, including Gantt charts.
Requires
- printable ebook (available at link)
Suggested time
3 hoursEnables students to:
- use a series of questions to plan and manage a project
- gain an introduction to Gantt charts.

Years 7–8 Gantt Project
Use this offline tool for a simple and free alternative to Microsoft Project. Gantt Project must be installed on Windows, Mac or Linux.
Requires
- computers or laptops
Suggested time
30 minutesEnables students to:
- create and maintain a Gantt chart to plan a full project from start to finish.

Years 7–8 Microsoft Project
Use this tool to create and maintain Gantt charts. Microsoft Project may be available to your school as part of a Microsoft suite. Excel can also be used to create basic Gantt charts.
Requires
- computers or laptops
Suggested time
30 minutesEnables students to:
- create and maintain a Gantt chart to plan a full project from start to finish.
Further reading and professional learning
-
Agile in industry
Find out more -
Five structures for helping students learn project management
Find out more
Years 7–8 Agile in industry
View this professional learning session presented by an agile coach to senior computing teachers at a Victorian VCE conference.
Suggested time
33 minutes
Years 7–8 Five structures for helping students learn project management
Read this blog post for advice on teaching project management to school-age students.
Suggested time
30 minutes
Primary and secondary data investigation
What is this about?
Using agile project management, students work in teams to conduct a data investigation for a specific audience.
A design process like the ones already introduced in the 'Creating a digital solution’ unit can be applied to a data investigation as follows:
- Define a problem or opportunity requiring information from data, employing user stories to empathise with the target audience for the solution.
- Ideate and design the information presentation, which will take the form of an infographic with data visualisations.
- Develop the solution by
- collecting primary data through a digital survey
- collecting secondary data through an online repository
- using a spreadsheet (or, optionally, programming) to analyse the data and produce visualisations.
- presenting the information by developing the infographic according to the design.
- Evaluate and iterate on the solution to improve it.
Content descriptions
Define and decompose real-world problems with design criteria and by creating user stories AC9TDI8P04
Generate, modify, communicate and evaluate alternative designs AC9TDI8P08
Evaluate existing and student solutions against the design criteria, user stories and possible future impact AC9TDI8P10
Select and use a range of digital tools efficiently, including unfamiliar features, to create, locate and communicate content, consistently applying common conventions AC9TDI8P11
Select and use a range of digital tools efficiently and responsibly to share content online, and plan and manage individual and collaborative agile projects AC9TDI8P12
This sequence enables students to:
- practise a design methodology for the definition, design, development and evaluation of a data presentation solution
- conduct a data analysis with data collected from two sources
- produce an infographic with data visualisations
- apply agile project management to the collaborative project.
Resources to include
Resources to introduce
-
Get started with design thinking
Find out more -
Design thinking process diagram
Find out more -
The best infographic ever
Find out more

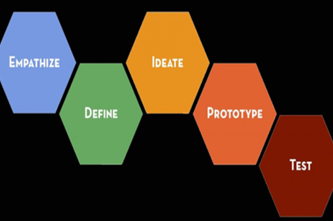

Years 7–8 Get started with design thinking
Revise the Stanford d.school's popular design thinking methodology with this activity.
Requires
- printable document (available at link)
Suggested time
1 hourEnables students to:
- practise working through the five steps of the Stanford d.school's design thinking methodology.
Years 7–8 Design thinking process diagram
Refer to this diagram of the Stanford d.school's popular design thinking methodology.
Requires
- internet access
- computers, laptops or tablets
Suggested time
30 minutesEnables students to:
- quickly refer to the five steps of the Stanford d school's design thinking methodology.

Years 7–8 The best infographic ever
Explore 100 infographics, including historical ones, and discuss what makes them powerful.
Requires
- internet access
- computers, laptops or tablets
Suggested time
30 minutesEnables students to:
- peruse a large collection of infographics
- discuss how the designs are effective (or not) at communicating information.

Resources to develop and consolidate learning


Years 7–8 Data science STEM resources
Choose from these six lessons in which students work with real datasets about marine and coastal populations of animals.
Requires
- computers, laptops or tablets
- spreadsheet software (e.g. Microsoft Excel, Google Sheets, Apple Numbers)
Suggested time
30 minutesEnables students to:
- perform investigations on real scientific datasets
- apply spreadsheet skills to analyse data and create visualisations.

Years 7–8 Canva
Use this online tool to create infographics. Offline presentation software such as Microsoft PowerPoint can also be used to create infographics.
Requires
- internet access
- computers, laptops or tablets
- free Canva accounts
Suggested time
30 minutesEnables students to:
- build attractive infographics from scratch or using existing templates
- import charts created in a spreadsheet, or create charts directly from data.

Resources to extend and integrate learning

Years 7–8 CSIRO educational datasets
Choose from these six lessons to work with real datasets using spreadsheets or with programming.
Requires
- computers, laptops or tablets
- spreadsheet software (e.g. Microsoft Excel, Google Sheets, Apple Numbers)
- optionally, a programming environment
Suggested time
3 hoursEnables students to:
- perform investigations on a diverse range of real datasets
- apply spreadsheet or programming skills to analyse data and create visualisations.

Further reading and professional learning

Years 7–8 Creating an infographic
Read this series of articles for an introduction to infographics and some of the tools used to create them.
Suggested time
30 minutes
Analysing sensor data
What is this about?
Using agile project management, students work in teams to conduct a data investigation where the data comes from electronic sensors.
A design process like the ones already introduced in the ‘Creating a digital solution’ unit can be applied to a data investigation as follows:
-
- Define a problem or opportunity requiring information from data, employing user stories to empathise with the target audience for the solution.
- Ideate and design the information presentation, which will take the form of an infographic with data visualisations.
- Develop the solution by
-
- collecting data from school data loggers, or from a programmable classroom device like the micro:bit
- using a spreadsheet (or, optionally, programming) to analyse the data and produce visualisations.
- presenting the information by developing the infographic according to the design.
-
- Evaluate and iterate on the solution to improve it.
Content description
Define and decompose real-world problems with design criteria and by creating user stories AC9TDI8P04
Generate, modify, communicate and evaluate alternative designs AC9TDI8P08
Evaluate existing and student solutions against the design criteria, user stories and possible future impact AC9TDI8P10
Select and use a range of digital tools efficiently, including unfamiliar features, to create, locate and communicate content, consistently applying common conventions AC9TDI8P11
Select and use a range of digital tools efficiently and responsibly to share content online, and plan and manage individual and collaborative agile projects AC9TDI8P12
This sequence enables students to:
- practise a design methodology for the definition, design, development and evaluation of a data presentation solution
- conduct a data analysis with data collected from electronic sensors
- (optionally) practise programming an electronic device like the micro:bit
- produce an infographic with data visualisations
- apply agile project management to the collaborative project.
Supplementary information
The resources in this pathway option assume a class set of micro:bit devices (enough for one per team), however other options may be available in your school, such as data loggers in a science lab or classroom robotics like Lego robotics kits.
The pathway also includes some programming to set up the micro:bit for data collection. Students may use Python or JavaScript to apply general purpose programming skills relevant to Years 7–8, or the programming for this unit may be done using visual code.
Resources to include
Resources to introduce
-
Get started with design thinking
Find out more -
Design thinking process diagram
Find out more -
The best infographics ever
Find out more
Years 7–8 Get started with design thinking
Revise the Stanford d.school's popular design thinking methodology with this activity.
Requires
- printable document (available at link)
Suggested time
1 hourEnables students to:
- practise working through the five steps of the Stanford d.school's design thinking methodology.
Years 7–8 Design thinking process diagram
Refer to this diagram of the Stanford d.school's popular design thinking methodology.
Requires
- internet access
- computers, laptops or tablets
Suggested time
30 minutesEnables students to:
- quickly refer to the five steps of the Stanford d.school's design thinking methodology.

Years 7–8 The best infographics ever
Explore 100 infographics, including historical ones, and discuss what makes them powerful.
Requires
- internet access
- computers, laptops or tablets to view video
Suggested time
30 minutesEnables students to:
- peruse a large collection of infographics
- discuss how the designs are effective (or not) at communicating information.
Resources to develop and consolidate learning
-
micro:bit sensors
Find out more -
Data logging with the micro:bit
Find out more -
micro:bit Python editor
Find out more -
Canva
Find out more


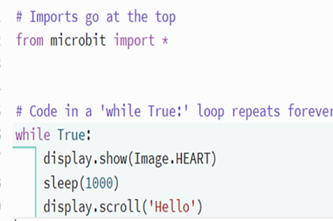
Years 7–8 micro:bit sensors
Learn how to program your micro:bit to measure your environment using its built-in sensors. Explore the function of each sensor.
Requires
- internet access
- computers, laptops or tablets
- physical micro:bit and access to makecode.microbit.org
Suggested time
30 minutesEnables students to:
- understand the various sensors on the micro:bit available for data investigation.

Years 7–8 Data logging with the micro:bit
Use this guide to begin logging data for collection from the micro:bit V2, with alternative advice for the micro:bit V1. This guide is not recommended for introducing students to the micro:bit. See the ‘Creating a digital solution’ unit for introductory resources.
Requires
- internet access
- computers, laptops or tablets
- class set of micro:bits
Suggested time
1 hourEnables students to:
- program the micro:bit to log sensor data (such as temperature, light or sound levels)
- retrieve the logged data and export it for analysis in a spreadsheet.
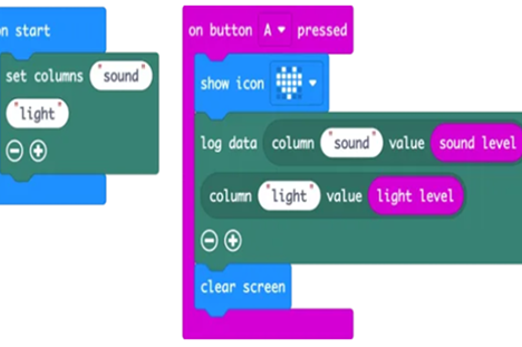
Years 7–8 micro:bit Python editor
The micro:bit Python editor is dedicated to general purpose programming in Python.
Requires
- internet access
- computers, laptops or tablets
- class set of micro:bits
Suggested time
30 minutesEnables students to:
- use general purpose programming in Python to code the micro:bit, including the data logging capabilities.
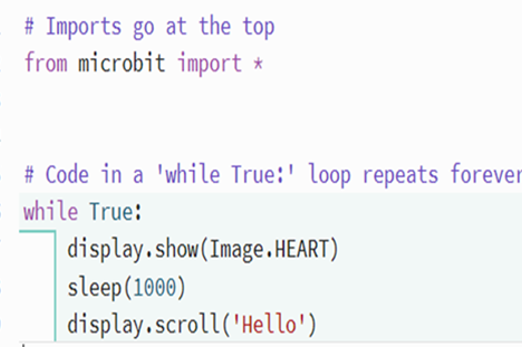
Years 7–8 Canva
Use this online tool to create infographics.
Requires
- internet access
- computers, laptops or tablets
- free Canva accounts
Suggested time
30 minutesEnables students to:
- build attractive infographics from scratch or using existing templates
- import charts created in a spreadsheet, or create charts directly from data.
Further reading and professional learning
-
Science exploration with the micro:bit
Find out more -
micro:bit classroom
Find out more -
Creating an infographic
Find out more


Years 7–8 Science exploration with the micro:bit
Undertake this short course to learn how to sense and log data with the micro:bit in your classroom.
Suggested time
30 minutes
Years 7–8 micro:bit classroom
Manage class sessions with the micro:bit, including through the Python editor.
Suggested time
30 minutes
Years 7–8 Creating an infographic
Read this series of articles for an introduction to infographics and some of the tools used to create them.
Suggested time
30 minutes
Machine learning research
What is this about?
This pathway option provides an alternative, open-ended research opportunity without requiring a spreadsheet or conventional programming approach to data analysis.
Using agile project management, students work in teams to conduct an investigation into an AI tool such as Google Teachable Machine. The research could consider one or more of the following questions, and should include testing of an actual tool to inform conclusions:
- How does machine learning differ from spreadsheet or conventional programming?
- What is data bias or algorithmic bias, and what problems can it cause?
- With the use of AI applications, what are the implications for data privacy?
A design process like the ones already introduced in the ‘Creating a digital solution’ unit can be applied to a data investigation as follows:
- Define a problem or opportunity requiring information from data, employing user stories to empathise with the target audience for the solution.
- Ideate and design the information presentation, which will take the form of an oral presentation, poster or infographic.
- Develop the solution by:
- performing testing on an AI tool to obtain some quantitative data that might inform how it works
- undertaking separate, qualitative research on AI and machine learning
- analysing the test results to produce information
- presenting the information and research findings as an oral presentation, poster or infographic.
- Evaluate and iterate on the solution to improve it.
Content descriptions
Define and decompose real-world problems with design criteria and by creating user stories AC9TDI8P04
Generate, modify, communicate and evaluate alternative designs AC9TDI8P08
Evaluate existing and student solutions against the design criteria, user stories and possible future impact AC9TDI8P10
Select and use a range of digital tools efficiently, including unfamiliar features, to create, locate and communicate content, consistently applying common conventions AC9TDI8P11
Select and use a range of digital tools efficiently and responsibly to share content online, and plan and manage individual and collaborative agile projects AC9TDI8P12
This sequence enables students to:
- practise a design methodology for the definition, design, development and evaluation of a data presentation solution
- conduct a data analysis with data collected from testing as well as qualitative research
- produce an information presentation – an oral presentation, poster or infographic
- apply agile project management to the collaborative project.
Supplementary information
This pathway option is slightly less defined than the other two pathway options, and may be more suited to students with a particular interest in the topic of AI and machine learning.
Resources to include
Resources to introduce
-
Introduction to AI & machine learning
Find out more -
Get started with design thinking
Find out more -
Design thinking process diagram
Find out more -
The best infographics ever
Find out more

Years 7–8 Introduction to AI & machine learning
Watch this brief explainer video to introduce the concept of machine learning in the context of image recognition.
Requires
- internet access
- computers, laptops or tablets to view video
Suggested time
30 minutesEnables students to:
- gain a brief introduction to how machine learning differs from traditional decision making
- learn the basics of how image recognition through AI works.

Years 7–8 Get started with design thinking
Revise the Stanford d.school's popular design thinking methodology with this activity.
Requires
- printable document (available at link)
Suggested time
1 hourEnables students to:
- practise working through the five steps of the Stanford d.school's design thinking methodology.
Years 7–8 Design thinking process diagram
Refer to this diagram of the Stanford d.school's popular design thinking methodology.
Requires
- internet access
- computers, laptops or tablets
Suggested time
30 minutesEnables students to:
- quickly refer to the five steps of the Stanford d.school's design thinking methodology.
Years 7–8 The best infographics ever
Explore 100 infographics, including historical ones, and discuss what makes them powerful.
Requires
- internet access
- computers, laptops or tablets
Suggested time
30 minutesEnables students to:
- peruse a large collection of infographics
- discuss how the designs are effective (or not) at communicating information.
Resources to develop and consolidate learning
-
AI image recognition and bias
Find out more -
Google Teachable Machine
Find out more -
The sweet computer
Find out more -
My computer brain
Find out more -
How AI works
Find out more -
Analysis of AI applications, drawing on ethical understandings
Find out more

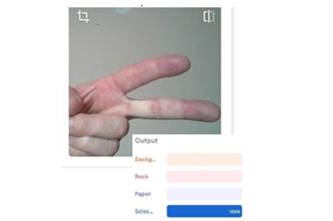


Years 7–8 AI image recognition and bias
Use this lesson for a hands-on exploration of data bias in an image recognition system.
Requires
- internet access
- computers, laptops or tablets
Suggested time
1 hourEnables students to:
- explore how machine learning systems incorporate bias through the data used to train them.

Years 7–8 Google Teachable Machine
Use this tool to train an AI to recognise images or sound data using machine learning. Note help protect student privacy and personal information avoid students capturing their own image or voice data.
Requires
- internet access
- computers, laptops or tablets
Suggested time
30 minutesEnables students to:
- quickly capture images and sounds
- assign data to labels and train an AI model to recognise similar images or sounds.

Years 7–8 The sweet computer
Use this unplugged lesson to model a machine learning system using paper and lollies.
Requires
- printed sheets and various sheets of paper (see document)
- plastic cups
- lollies
Suggested time
1 hourEnables students to:
- explore how a machine can ‘learn’ through a hands-on process.

Years 7–8 My computer brain
Demonstrate machine learning in action with this series of visualisations.
Requires
- internet access
- computers, laptops or tablets
- free teacher access to ‘My computer brain’
Suggested time
1 hourEnables students to:
- visualise machine learning as it takes place
- run experiments that explore how machine learning works with data.

Years 7–8 How AI works
Use this series of seven lessons to explore AI concepts, including more recent generative AI applications.
Requires
- internet access
- computers, laptops or tablets
- free code.org accounts
Suggested time
7 hoursEnables students to:
- explore neural networks for machine learning
- explore computer vision for image recognition
- explore large language models for generative AI applications
- discuss ethical considerations of AI.

Years 7–8 Analysis of AI applications, drawing on ethical understandings
Use this lesson to apply a framework for ethical understanding to scenarios involving AI.
Requires
- internet access
- computers, laptops or tablets
Suggested time
1 hourEnables students to:
- learn and apply a framework for ethical understanding.
Resources to extend and integrate learning


Years 7–8 AI lessons
Access and choose from all AI-related lessons for Years 7 and 8 hosted on the Digital Technologies Hub.
Requires
- varied
Suggested time
variedEnables students to:
- varied.

Years 7–8 AI and machine learning
Use this complete course unit to delve into AI and machine learning with interactives
Requires
- internet access
- computers, laptops or tablets
- free code.org accounts
Suggested time
15 hoursEnables students to:
- work with code.org's AppLab to incorporate AI functionality
- consider ethics in AI use.
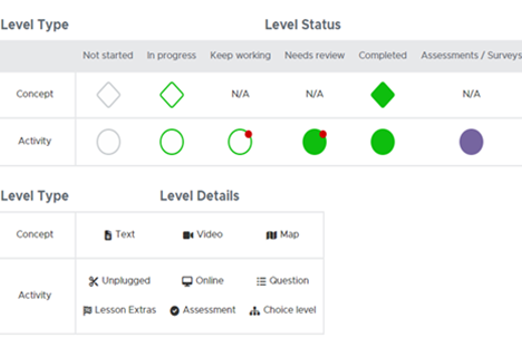
Further reading and professional learning
-
AI in the classroom
Find out more -
AI 101 for teachers
Find out more -
Creating an infographic
Find out more
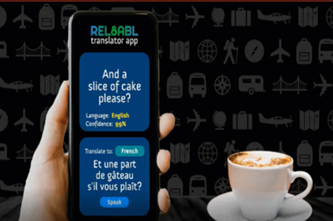

Years 7-8 AI in the classroom
Choose a module from our AI course, consisting of 7 modules, designed to provide an introduction to artificial intelligence and how it can be used for an authentic context for learning.
Suggested time
1-2 hours
Years 7-8 AI 101 for teachers
Use this series of webinars for insights from educators and industry, covering more recent generative AI applications.
Suggested time
30 minutes
Years 7-8 Creating an infographic
Read this series of articles for an introduction to infographics and some of the tools used to create them.
Suggested time
30 minutes
Creating a digital solution
Overview
This unit provides an opportunity for students to apply the skills for understanding and implementing algorithms from the ‘General-purpose programming’ unit in the context of a design project. Design thinking methodology and user experience design are explicitly introduced in pathway 1, then three different option pathways provide contexts and ideas for student projects that involve programming and a user interface as part of the solution. Choose one option pathway that suits your students’ needs, school context and available resources.
Achievement standards
By the end of Year 8 students develop and modify creative digital solutions, decompose real-world problems, and evaluate alternative solutions against user stories and design criteria.
They design and trace algorithms and implement them in a general-purpose programming language.
Australian Curriculum
Content descriptions
Investigating and defining AC9TDI8P04
Generating and designing AC9TDI8P07, AC9TDI8P08
Evaluating AC9TDI8P10
Related content and General Capabilities
Mathematics: Space AC9M7SP04, AC9M8SP04
Digital Literacy: Creating and exchanging, Managing and operating
Critical and Creative Thinking
This topic enables students to
- familiarise themselves with a design methodology, and use it to guide their project
- explore principles for effective user experience/user interface design
- design a solution using user stories and design criteria
- develop the solution by applying the programming skills from the ‘General-purpose programming’ unit
- test and evaluate the solution.
Supplementary information
This unit is intended to be undertaken after the ‘General-purpose programming’ unit, which introduces algorithms and programming skills.
The three option pathways in this unit provide different product types to aim for, all of which involve a programming component.
- The pathway ‘Creating an app’ focuses on the development of software with a specific kind of user interface tailored to mobile devices.
- The pathway ‘Creating a game’ focuses on the development of a video game, with multiple options for design platforms that can use Python and/or JavaScript for the programming.
- The pathway 'Robots and programmable machines' focuses on the development of a smart machine or robot with physical components. Students design and construct the machine as well as programming its ‘brain’, using the popular micro:bit classroom device or other options available in your school.
Watch this video for a quick overview of the unit and how to use its resources with your students.
Assessment View assessment advice
Achievement standards
Digital Technologies: Years 7-8
By the end of Year 8 students develop and modify creative digital solutions, decompose real-world problems, and evaluate alternative solutions against user stories and design criteria.
They design and trace algorithms and implement them in a general-purpose programming language.
They select and use a range of digital tools efficiently and responsibly to create, locate and share content; and to plan, collaborate on and manage projects.
Assessment tasks
Use this Teaching unit and assessment task design by Qld teacher Nathaniel Brown, that guides students to design and program a digital game focused on Totems , incorporating Aboriginal and Torres Strait Islander histories and cultures, Intercultural Understanding and Digital Literacy.
Use this ACARA worksample Digital project: website design to guide your assessment.
In this task students design a website.
The task shows evidence of students' demonstrated ability to:
- develop and modify creative digital solutions, decompose real-world problems, and evaluate alternative solutions against user stories and design criteria
- select and use a range of digital tools efficiently and responsibly to create content; and to plan, and manage projects.
Rubric
Use this rubric to guide assessment of students' demonstrated ability to:
- develop and modify creative digital solutions, decompose real-world problems, and evaluate alternative solutions against user stories and design criteria
- design and trace algorithms and implement them in a general-purpose programming language.
Rubric: Design that incorporates programming
| Design user interface (graphical) | with guidance, proposes a simple interface that suits the purpose of the solution and with support creates an interface with some key elements for the intended user | designs an interface that addresses the problem, showing some consideration for user needs and creates an interface with some key elements for the intended user | designs a interface that effectively addresses the problem and considers user needs and most elements of the interface are clear and suitable to the intended user | designs an interface that is efficient and effective for the purpose of the solution and effectively addresses the problem and considers user needs and all elements of interface are clear, complete and suitable to the intended user |
| Algorithm design | with guidance, creates a basic flow chart or pseudocode, however does not fully capture: iteration (loops), branching (decisions), variables, user input and output | creates a basic flow chart or pseudocode, where appropriate, algorithm correctly incorporates some of the following: iteration (loops), branching (decisions), variables, user input and output | creates a flow chart or pseudocode, where appropriate, algorithm correctly incorporates: iteration (loops), branching (decisions), variables, user input and output | creates an efficient and effective, flow chart or pseudocode, where appropriate, algorithm correctly incorporates: iteration (loops), branching (decisions), variables, user input and output |
| Develop code – overall functionality | with guidance and support, creates a basic functional code that runs after addressing syntax errors and partly addresses the functional requirements or design | creates a basic functional code that contains bugs that affects some functionality and runs successfully with support and guidance to include minor modifications and partly addresses the functional requirements or design | creates a code that is mostly complete and free of syntax errors, mostly free of bug and runs successfully, and program meets most functional requirements and mostly fulfils design | creates a code that is complete and free of syntax error, free of bugs and runs successfully and program meets all functional requirements and fulfils design |
| Implement general purpose programs (micro:bit) | with guidance, is directed to produce a program that includes some of the following skills: iteration (loops), branching (decisions), variables, user input and output | produces a program using some of the following skills: iteration (loops), branching (decisions), variables, user input and output | creates a program and where appropriate, most of the following skills are utilised: iteration (loops), branching (decisions), variables, user input and output | creates a program and where appropriate, all the following skills are utilised thoroughly and efficiently: iteration (loops), branching (decisions), variables, user input and output |
| Error tracing - testing | with guidance and support, tests for coding errors and fixes them | undertakes testing of code without the use of a testing tool such as a testing table | undertakes formal testing that includes most of the following (where appropriate): unexpected user input or data, out of range input or data (boundary checking),wrong type input or data. Testing tool (eg. testing table) mostly complete and used correctly | undertakes formal testing that includes all of the following (where appropriate): unexpected user input or data, out of range input or data (boundary checking), wrong type input or data. Testing tool (eg. testing table) complete and used effectively |
Unit sequence
This topic offers 3 pathways
Core Unit
Designing for the user
Students follow the process of design thinking to guide the creation of a solution for a need or opportunity.Creating an app
Students design and build a prototype or proof of concept for an app to address a user need.Creating a game
Students design and build a proof of concept for a video game for a particular user or audience.Robots and programmable machines
Students design, build and code a proof of concept for a particular user or audience, taking the form of a smart machine or robot.Designing for the user
What is this about?
Design thinking can provide a series of steps to guide the creation of a solution for a need or opportunity.
A typical design methodology begins with empathising through user stories, to understand the need or opportunity. Alternative designs that incorporate user experience principles, such as for an app's user interface, are generated, modified and chosen. In this case, where the solution includes programming, the core algorithms for the solution are also designed. Evaluation criteria are developed, and will be used later to assess whether the solution is successful. The solution is implemented by programming and testing it, as well as by making any physical aspects of the solution. Finally, the solution is evaluated and its impact considered.
Critically, this is an iterative process where many of the above steps may reoccur.
Content description
Define and decompose real-world problems with design criteria and by creating user stories AC9TDI8P04
Design the user experience of a digital system AC9TDI8P07
Generate, modify, communicate and evaluate alternative designs AC9TDI8P08
Evaluate existing and student solutions against the design criteria, user stories and possible future impact AC9TDI8P10
This sequence enables students to:
- familiarise themselves with a design methodology that will be used to guide the creation of a digital solution
- identify and practice principles for user experience design.
Resources to include
Resources to introduce
-
The design thinking process
Find out more -
User stories slides
Find out more -
User inyerface
Find out more


Years 7–8 The design thinking process
Watch this short video for an overview of a popular five-step design thinking methodology.
Requires
- internet access
- computers, laptops or tablets to view video
Suggested time
4 minutesEnables students to:
- gain a quick introduction to the five steps of the Stanford d.school's popular design thinking methodology.
Years 7–8 User stories slides
Use this set of slides to introduce or refresh user stories with class tasks and discussions.
Requires
- printable document (available in slides)
Suggested time
20 minutesEnables students to:
- practise writing three-statement user stories for different user needs.

Years 7–8 User inyerface
Use this quick online challenge to encourage thinking about what makes a good or bad user interface.
Requires
- internet access
- computers, laptops or tablets
Suggested time
15 minutesEnables students to:
- appreciate the impact of poor user interface design choices.

Resources to develop and consolidate learning
-
UX/UI design course
Find out more -
Design thinking process diagram
Find out more -
Human computer interaction: Heuristics
Find out more -
Human computer interaction: Think-aloud protocol
Find out more -
Design thinking course
Find out more -
The design process: User centred design
Find out more


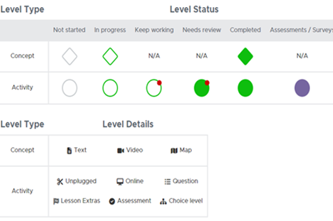
Year 7–8 UX/UI design course
Use this course along with unplugged resources to practice key tools for user interface design in the context of a mobile app.
Requires
- internet access
- computers, laptops or tablets
- free Grok learning accounts
Suggested time
3 hoursEnables students to:
- use design tools to prototype and design mobile interfaces.

Year 7–8 Design thinking process diagram
Refer to this diagram of the Stanford d.school's popular design thinking methodology.
Requires
- internet access
- computers, laptops or tablets
Suggested time
30 minutesEnables students to:
- quickly refer to the five steps of the Stanford d.school's design thinking methodology.
Year 7–8 Human computer interaction: Heuristics
Use this lesson and the linked activities to connect a set of 10 heuristics to user interface design.
Requires
- internet access
- computers, laptops or tablets
- printable document (available at link)
Suggested time
1 hourEnables students to:
- explore Jakob Nielsen's 10 heuristics and how they apply to user experience.

Year 7–8 Human computer interaction: Think-aloud protocol
Use this lesson to introduce the think-aloud protocol for assessing usability of interfaces.
Requires
- internet access
- computers, laptops or tablets
Suggested time
1 hourEnables students to:
- practice using the think-aloud protocol to question and assess user interfaces.
Year 7–8 Design thinking course
Use this course along with unplugged resources to explore and apply design thinking steps.
Requires
- internet access
- computers, laptops or tablets
- free Grok learning accounts
Suggested time
5 hoursEnables students to:
- learn to apply design thinking concepts through online exercises and unplugged activities.

Year 7–8 The design process: User centred design
Use Chapter 1 of this online course to explore and practise user-centred design in the context of a mobile app.
Requires
- internet access
- computers, laptops or tablets
- free code.org accounts
Suggested time
8 hoursEnables students to:
- learn and apply user-centred design through a series of lessons.

Resources to extend and integrate learning
Years 7–8 The double diamond
Refer to this article to discover the Design Council's Double Diamond, a way of describing the flow of a design process.
Requires
- internet access
- computers, laptops or tablets
Suggested time
30 minutesEnables students to:
- gain a quick overview of the Double Diamond, visualising the flow of a design process.
Years 7–8 I love algorithms: Creation kit for K12
Run this unplugged game to ideate applications for machine learning without coding.
Requires
- printable cards and spreads (available at link)
Suggested time
1 hourEnables students to:
- ideate possible design applications for different known machine-learning algorithms
- consider the impact and implications of these applications.

Further reading and professional learning
-
Human computer interaction - Computer science field guide
Find out more -
My product design process
Find out more
Years 7–8 Human computer interaction - Computer science field guide
This free online chapter covers topics connected to user experience and user interface design, and includes online interactives.
Suggested time
30 minutes
Years 7–8 My product design process
This video is a walkthrough of and reflection on a design process using the Design Council's Double Diamond.
Suggested time
30 minutes
Creating an app
What is this about?
Students design and build a prototype or proof of concept for an app to address a user need. In some cases, a student proof of concept may provide only a functional program without a graphical user interface, so designs for a graphical user interface may be provided separately.
A design process is applied as follows:
- Define the problem or opportunity employing user stories to empathise with the target user for the solution.
- Ideate and design the app, including both the user interface and core algorithms that make it functional.
- Develop the solution by programming and testing it.
- Evaluate and iterate on the solution to improve it.
Content description
Define and decompose real-world problems with design criteria and by creating user stories AC9TDI8P04
Design the user experience of a digital system AC9TDI8P07
Generate, modify, communicate and evaluate alternative designs AC9TDI8P08
Evaluate existing and student solutions against the design criteria, user stories and possible future impact AC9TDI8P10
This sequence enables students to:
- practise a design methodology for the definition, design, development and evaluation of an app
- apply user experience design principles to design the app's user interface
- design a core algorithm that makes the solution functional
- apply general-purpose programming to code the solution and test it.
Supplementary information
Two different development options are suggested in the resources (Python and JavaScript). These might be selected based on programming language undertaken earlier and on ability levels.
If possible, students in Years 7–8 should apply their knowledge from the ‘General-purpose programming’ unit by using a language like Python or JavaScript for the programming, but note that one resource only allows for visual (blocks) coding.
Resources to include
Resources to introduce
Years 7–8 Design sprint case study
Watch this video for an example of an industry team's design process in creating a successful app.
Requires
- internet access
- computers, laptops or tablets
- free code.org accounts
Suggested time
16 minutesEnables students to:
- see the different stages of the design process applied by a team developing an app.
Resources to develop and consolidate learning
-
App lab
Find out more -
MIT app inventor
Find out more -
Coding for GUIs course
Find out more -
Draw.io
Find out more -
Sample usability heuristic questions
Find out more

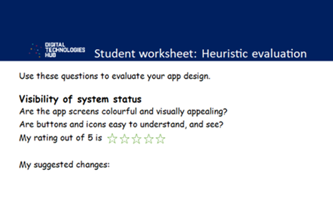
Years 7–8 App lab
Choose the Unit ‘The design process’ from the Computer Science Discoveries course and use Chapter 2 to guide the design and coding of an app in JavaScript.
Requires
- internet access
- computers, laptops or tablets
Suggested time
30 minutesEnables students to:
- see the different stages of the design process applied by a team developing an app.
Years 7–8 MIT app inventor
Use this online environment to design and code apps that can be tested on real mobile devices or a software emulator. (Visual coding only.)
Requires
- internet access
- computers, laptops or tablets
- (optional) mobile devices for testing
Suggested time
12 hoursEnables students to:
- use a coding environment centred around app design and development
- apply JavaScript programming to the coding of the app
- alternate between typing code and using blocks.

Years 7–8 Coding for GUIs course
Choose this online lesson series to consider principles of graphical user interface (GUI) design, and employ JavaScript programming in the context of a webpage user interface.
Requires
- internet access
- computers or laptops
Suggested time
12 hoursEnables students to:
- undertake a series of lessons designed to be run by a teacher
- program with JavaScript alongside HTML and CSS to make interactive webpages
- learn some basic principles of user interface design.
Years 7–8 Draw.io
Use this free online tool to draw wireframes and other diagrams. Common software like Microsoft PowerPoint and Google Slides can also be used to draw wireframes.
Requires
- internet access
- computers, laptops or tablets
Suggested time
30 minutesEnables students to:
- use standard symbols to draw wireframes.
Years 7–8 Sample usability heuristic questions
This resource lists ten general principles for interaction design along with two app design example questions for each principle.
Requires
- printed or digitally displayed document
Suggested time
30 minutesEnables students to:
- systematically assess their app designs and evaluate the effectiveness of various design elements
- identify potential issues related to UX, navigation and overall usability within their app designs
- gain insights that enable them to refine and optimise user interfaces in line with design principles.
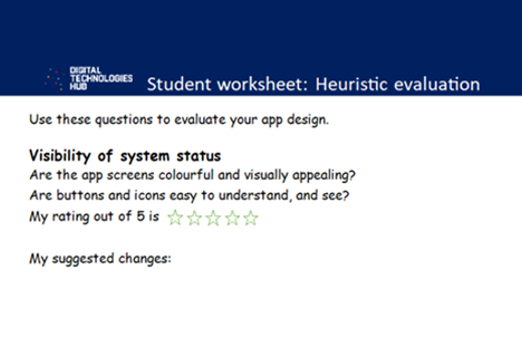
Resources to extend and integrate learning
Years 7–8 PySimpleGUI
Use this library to develop a graphical user interface in Python.
Requires
- computers or laptops
- an online Python environment (e.g replit online environment), or offline Python environment (e.g. Thonny)
Suggested time
30 minutesEnables students to:
- build programs with graphical elements.

Further reading and professional learning
-
Paper prototyping
Find out more -
User paper prototyping to redesign Microsoft Office 365 apps
Find out more

Years 7–8 Paper prototyping
This article covers the whys and hows of prototyping user interfaces on paper.
Suggested time
30 minutes
Years 7–8 User paper prototyping to redesign Microsoft Office 365 apps
See how students have used Paper Prototyping to describe changes to interfaces for three collaborative tools.
Suggested time
30 minutes
Creating a game
What is this about?
Students design and build a proof of concept for a video game for a particular user or audience.
A design process is applied as follows:
- Define the problem or opportunity employing user stories to empathise with the target user for the solution.
- Ideate and design the game, including both the user interface and core algorithms that make it functional.
- Develop the solution by programming and testing it.
- Evaluate and iterate on the solution to improve it.
Content description
Define and decompose real-world problems with design criteria and by creating user stories AC9TDI8P04
Design the user experience of a digital system AC9TDI8P07
Generate, modify, communicate and evaluate alternative designs AC9TDI8P08
Evaluate existing and student solutions against the design criteria, user stories and possible future impact AC9TDI8P10
This sequence enables students to:
- practise a design methodology for the definition, design, development and evaluation of a game
- apply user experience design principles to design the game's user interface
- design a core algorithm that makes the solution functional
- apply general-purpose programming to code the solution and test it
Supplementary information
Some tools for game development allow a tighter focus on design and require only visual coding or no traditional programming at all (e.g. GDevelop, Construct 3) while others require the use of a custom scripting language (e.g. GameMaker).
Suggested resources allow students to apply their knowledge from the ‘General-purpose programming’ unit by using a language like Python, JavaScript or C# for programming.
Resources to include
Resources to introduce
Years 7–8 Game development for noobs
Watch this video for a very simple breakdown of the components of a game.
Requires
- internet access
- computers, laptops or tablets to view video
Suggested time
12 minutesEnables students to:
- gain a simple overview of four main components of a game: scenes, assets, code and system.
Years 7–8 How game developers solved these 11 problems
Watch this video for case studies of design challenges that were overcome through clever design.
Requires
- internet access
- computers, laptops or tablets to view video
Suggested time
16 minutesEnables students to:
- explore and discuss examples of game design challenges and how they were overcome.

Resources to develop and consolidate learning
-
Lesson 7: A Text Adventure Game
Find out more -
Python arcade
Find out more -
Ursina engine
Find out more -
Game lab
Find out more -
Kaboom
Find out more -
MakeCode Arcade
Find out more -
MicroStudio
Find out more


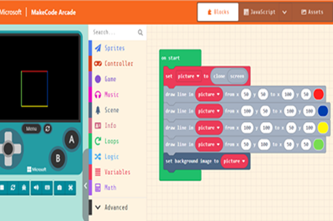
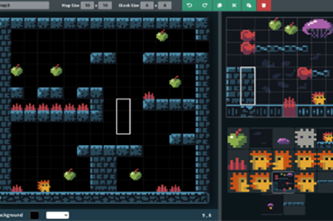
Years 7–8 Lesson 7: A Text Adventure Game
Build a simple text adventure game which can be implemented as an assessment task.
Requires
- internet access
- computers or laptops
Suggested time
3–4 hoursEnables students to:
- create a text based game in a Python type environment with supporting instructions.

Years 7–8 Python arcade
Use this Python library to develop 2D games.
Requires
- computers or laptops
- an offline Python environment (e.g. Thonny)
- tutorials and documentation on the website
Suggested time
30 minutesEnables students to:
- use extra functions and variables in their python code to make 3D games
- avoid some of the more complex base code needed for engines like Panda.
Years 7–8 Ursina engine
Use this Python library to develop 3D games.
Requires
- computers or laptops
- an offline Python environment (e.g. Thonny)
- tutorials and documentation on the website
Suggested time
30 minutesEnables students to:
- use extra functions and variables in their Python code to make 3D games
- avoid some of the more complex base code needed for engines like Panda.
Years 7–8 Game lab
Choose the unit ‘Interactive animation and games’ from the Computer Science Discoveries course to guide the design and coding of a game in JavaScript.
Requires
- internet access
- computers, laptops or tablets
- free code.org accounts
Suggested time
12 hoursEnables students to:
- use a coding environment centred around app design and development
- apply JavaScript programming to the coding of the app
- alternate between typing code and using blocks.
Years 7–8 Kaboom
Use this JavaScript library to develop 2D games. Relevant tutorials can be found on the official site.
Requires
- computers or laptops
- a JavaScript environment (e.g. using a replit.com template)
Suggested time
30 minutesEnables students to:
- use extra functions and variables in their JavaScript code to make 2D games.

Years 7–8 MakeCode Arcade
Code a handheld game device in Python or JavaScript using the same environment as the micro:bit device (simulator available if no devices).
Requires
- internet access
- computers, laptops or tablets
- MakeCode Arcade devices (A simulator allows games to be made without actual devices)
Suggested time
30 minutesEnables students to:
- write and test code for the MakeCode Arcade, a small Game Boy-like device designed for making games
- use Python or JavaScript.
Years 7–8 MicroStudio
Code 2D games in a clean, online environment with the option to use Python or JavaScript.
Requires
- internet access
- computers or laptops
Suggested time
30 minutesEnables students to:
- create 2D games in Python or JavaScript but note that tutorials assume use of the custom microScript.

Resources to extend and integrate learning


Years 7–8 AdventureLib
Use this Python library to develop old-style text adventures without graphics
Requires
- computers or laptops
- a Python environment (e.g. Thonny)
- tutorials and documentation on the website
Suggested time
30 minutesEnables students to:
- use extra functions and variables in their Python code just for making traditional text adventures.
Years 7–8 Unity
Consider this industry-level game development environment for experienced students to code 2D or 3D games in C# language.
Requires
- computers or laptops (Unity must be installed on Windows, Mac or Linux
Suggested time
30 minutesEnables students to:
- use an industry-level game-development environment
- programming in C#, a general-purpose programming language with syntax similar to JavaScript.

Further reading and professional learning
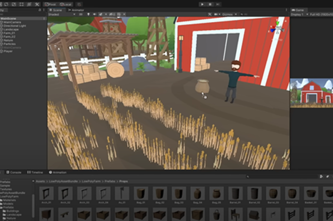
Years 7–8 Top Python game engines
This article provides an overview of popular libraries for Python that allow games to be programmed, including alternatives to the ones given in resources for this unit.
Suggested time
30 minutes
Years 7–8 I made the same game in 8 engines
This video provides a fun overview of eight current game development environments, many of which do not use a general-purpose programming language.
Suggested time
13 minutes
Robots and programmable machines
What is this about?
Students design, build and code a proof of concept for a particular user or audience, taking the form of a smart machine or robot. Solutions may range from highly practical to whimsical art pieces.
Note that many suggested resources offer guided tutorials with full code provided. These are suitable for learning and practising principles and skills of physical computing, but may not allow students the freedom to practise design thinking.
A design process is applied as follows:
- Define the problem or opportunity employing user stories to empathise with the target user for the solution.
- Ideate and design the solution, including both the user experience and core algorithms that make it functional.
- Develop the solution by constructing, programming and testing it.
- Evaluate and iterate on the solution to improve it.
Content description
Define and decompose real-world problems with design criteria and by creating user stories AC9TDI8P04
Design the user experience of a digital system AC9TDI8P07
Generate, modify, communicate and evaluate alternative designs AC9TDI8P08
Evaluate existing and student solutions against the design criteria, user stories and possible future impact AC9TDI8P10
This sequence enables students to:
- practise a design methodology for the definition, design, development and evaluation of a ‘physical computing’ solution
- apply user experience design principles to design the user experience
- design a core algorithm that makes the solution functional
- apply general-purpose programming to code the solution and test it.
Supplementary information
The resources in this pathway option assume a class set of micro:bit devices (enough for one per team) to act as the programmable ‘brain’ for a smart machine or robot. Connectable electronic components – such as motors, lights and sensors – allow for many different solutions, and these are typically available from electronics stores in kit form. Finally, structural materials such as cardboard or Lego are used to hold it all together.
Besides the micro:bit, other complete options may be available in your school, such as Lego robotics kits.
Students at Years 7–8 can apply their knowledge from the ‘General-purpose programming’ unit by using a language like Python or JavaScript for the programming, but most electronic devices also allow for visual (blocks) coding.
Resources to include
Resources to introduce

Years 7–8 Micro:bit
Introduce a classroom device that can be coded in Python and JavaScript. A simulator allows the course to be done without actual devices.
Requires
- internet access
- computers, laptops or tablets
- class set of micro:bits
Suggested time
30 minutesEnables students to:
- begin coding the micro:bit, a small microcontroller with an LED display and various sensors.

Years 7–8 Python intro to micro:bit
Introduce a classroom device that can be coded in Python. A simulator allows course to be done without actual devices. This official website includes tutorial lessons, but most are in visual code rather than Python or JavaScript.
Requires
- internet access
- computers or laptops
- free Grok learning accounts
- class set of micro:bits
Suggested time
6 hoursEnables students to:
- begin coding the micro:bit, a small microcontroller with an LED display and various sensors.
Resources to develop and consolidate learning
-
Mirco:bit Python editor
Find out more -
Creating apps with devices
Find out more -
Creating a digital start line and finish line with micro:bits
Find out more


Years 7–8 Mirco:bit Python editor
The micro:bit Python editor is dedicated to general-purpose programming in Python.
Requires
- internet access
- computers or laptops
- class set of micro:bits
Suggested time
30 minutesEnables students to:
- use general-purpose programming in Python to code the micro:bit device, including the data-logging capabilities.
Years 7–8 Creating apps with devices
Choose this course to build on the familiarity of the App Lab environment and learn to program the micro:bit.
Requires
- internet access
- computers or laptops with Chrome or Edge browser
- free code.org accounts
- class set of micro:bits
Suggested time
12 hoursEnables students to:
- use general-purpose programming in JavaScript to code the micro:bit
- practice prototyping a physical solution.
Years 7–8 Creating a digital start line and finish line with micro:bits
Use this lesson to guide students in designing and programming a specific physical solution with the micro:bit.
Requires
- internet access
- computers or laptops
- class set of micro:bits
Suggested time
3 hoursEnables students to:
- follow a tutorial to build and program digital start and finish lines for a race.
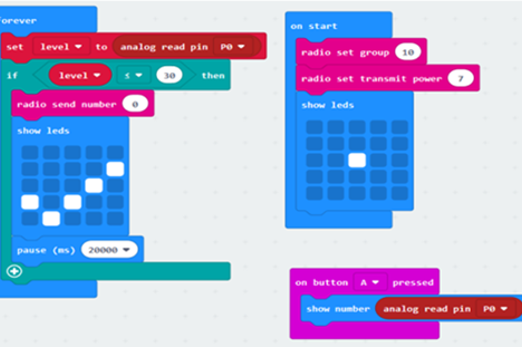
Resources to extend and integrate learning

Years 7–8 Physical tech from GO to WHOA!
Choose from this set of guided projects to practise making physical solutions involving the micro:bit and a modular expansion system.
Requires
- internet access
- computers or laptops
- class set of micro:bits
Suggested time
30 minutesEnables students to:
- use general-purpose programming in JavaScript or Python to code the micro:bit
- practice prototyping a physical solution.

Years 7–8 Tinkercad
Use this online platform to design objects for 3D printing, which allows student-produced physical structures in their solutions.
Requires
- internet access
- computers or laptops
- 3D printer
Suggested time
30 minutesEnables students to:
- use general-purpose programming in JavaScript or Python to code the micro:bit
- practise prototyping a physical solution.
Further reading and professional learning
-
Inspiring projects
Find out more -
Do your :bit
Find out more -
Awesome micro:bit
Find out more -
micro:bit classroom
Find out more

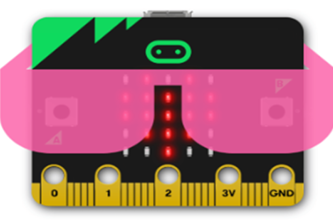
Years 7–8 Inspiring projects
A set of case studies and videos of a range of ideas for physical tech projects.
Suggested time
30 minutes
Years 7–8 Do your :bit
Ideas for micro:bit projects centred around the Global Goals.
Suggested time
30 minutes
Years 7–8 Awesome micro:bit
A vast, curated list of resources, including project ideas, for the micro:bit.
Suggested time
30 minutes