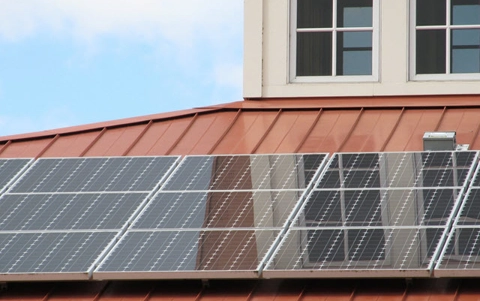
Solar energy installations
This lesson uses data about solar energy installations to investigate data analysis. The dataset shows how many solar systems were installed, in each postcode, from 2001 to 2016. It is a useful way to understand how to explore and characterise datasets as well as to explore the use of data in the media. This lesson was devised by Linda McIver, Australian Data Science Education Institute.
Additional details
| Year band(s) | 7-8 |
|---|---|
| Content type | Lesson ideas |
| Format | Web page |
| Core and overarching concepts | Data acquisition, Data interpretation |
| Australian Curriculum Digital Technologies code(s) |
AC9TDI8P01
Acquire, store and validate data from a range of sources using software, including spreadsheets and databases
AC9TDI8P02
Analyse and visualise data using a range of software, including spreadsheets and databases, to draw conclusions and make predictions by identifying trends |
| Keywords | Data collection, Data analysis, Spreadsheets, Excel, Graphing, Tables, Solar energy, Energy use, Linda McIver |
| Integrated, cross-curriculum, special needs | Mathematics, Science, STEM |
| Organisation | ESA |
| Copyright | Creative Commons Attribution 4.0, unless otherwise indicated. |
Related resources
-
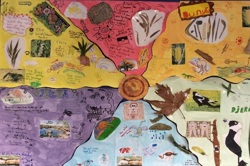
Classroom ideas F-10: Aboriginal and Torres Strait Islander connections to Digital Technologies
This resource provides examples of ways Aboriginal and Torres Strait Islander Histories and Cultures can be integrated into Digital Technologies. Examples include 'classification and sorting data' and 'designing solutions'.
-
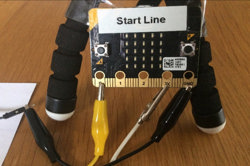
Creating a digital start line and finish line with micro:bits (Years 7-8)
The following activity suggests one-way Digital Technologies could be integrated into a unit where vehicles are being designed and produced.
-
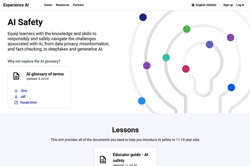
AI Safety
Equip learners with the knowledge and skills to responsibly and safely navigate the challenges associated with AI, from data privacy, misinformation, and fact-checking, to deepfakes and generative AI.
-
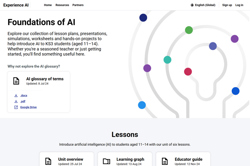
Foundations of AI
Explore our collection of lesson plans, presentations, simulations, worksheets and hands-on projects to help introduce AI to Years 7-8 students.
-
Home/School communications
In this lesson sequence, students use big data sets and school surveys, to design (and as an extension activity, make) a new digital communication solution for the school.
-
Data Science STEM resources
Here are some authentic datasets collected by research scientists studying marine and coastal animal populations.
-
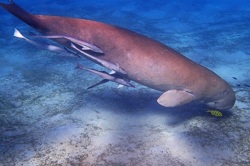
Protecting dugongs
The Western Australian Marine Science Institution has been collecting data about dugongs off the coast of the Kimberley in Northern WA.
-
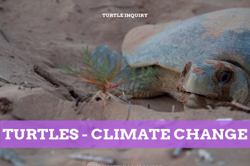
Turtles: impact of climate change on Flatback turtle populations
The lesson follows an inquiry process in which students use a dataset to answer relevant questions about the turtle population.