Data representation
This resource helps Digital Technologies teachers make sure their teaching of data representation
is aligned with the Australian Curriculum from Foundation to Year 10.
What you'll find
- Clear explanations of how data is represented.
- Ideas supporting progressive development of representation across Foundation to Year 10 Practical classroom activities
- Practical classroom activities
- Resources to help in planning and assessment
Data representation focus by year band
| Year band | Students learn to |
|---|---|
| Foundation | Use objects, pictures and symbols to represent ideas |
| 1 - 2 | Represent ideas using pictures, symbols, numbers and words |
| 3 - 4 | Explore how the same data can be represented in different ways |
| 5 - 6 | Represent data using whole numbers, binary (0/1) and pixel-based images |
| 7 - 8 | Understand how text, images and sound are represented in binary |
| 9 - 10 | Apply data representation and presentation though HTML/CSS, and explore compression (quality versus efficiency) |
What is data representation?
Data representation describes how information is shown and stored using objects, pictures, symbols, numbers, text and sound. In digital systems, this information is represented using number codes, most commonly the binary system.
A simpler explanation can help …
If we use a symbol of a sun to show it is a sunny day, that picture is representing data. If a computer stores the letter A as a number, that is also data representation.
Data representation is the way we show information so people and computers can understand it.
Why is it relevant?
Data representation helps students understand how computers store and show information such as text, pictures and sound. For younger students, understanding data representation begins with exploring how objects, pictures and symbols can represent ideas.
Key terms in the curriculum
These key terms appear across the curriculum and are revisited at increasing levels of complexity.
| Data | Data can be in the form of symbols, text, images and sound |
|---|---|
| Integers | Whole numbers used to represent values such as counts, scores or quantities. |
| Binary | A way digital systems represent data using two states (on/off). |
| Text representation | When characters (letters, numbers, symbols) are stored and represented in digital systems. |
|
Data |
Data such as numbers can be represented as images, tally marks, words and digits. |
|
Integers |
Whole numbers with no fractional or decimal part; for example, 0, 1, 2, −3, 42, 100.In digital systems, integers are used to represent things like counts, a person’s age, or lives left in a game. For example, a spreadsheet total or a game score is shown using integers, which are stored in a computer’s memory using binary. ’ |
|
Binary |
A single binary digit (0 or 1) can model just one of two states (for example, off/on, false/true, low/high). With more digits, binary can represent larger numbers. For example, the binary 01010010 represents the number 82 in the decimal system. ’ |
|
Text representation |
How characters (letters, numbers and symbols) are assigned numeric values that are converted into binary. Standards such as American Standard Code for Information Interchange (ASCII) and Unicode define this mapping. For example, the letter R has the ASCII value 82, which in binary is 01010010. ’ |
What to teach?
Data representation is introduced early, from Foundation, and builds in complexity right through to Year 10.
Here’s how the concept develops across year bands:
Data representation in Foundation
Expectation for this band
Students can:
- use pictures, symbols and numbers to represent familiar ideas
- describe what a representation shows
- identify features that help others recognise a representation.
The focus is on understanding that objects, pictures and symbols can stand for ideas and help us communicate meaning.
What this looks like in practice
Students explore representation through familiar, everyday contexts using concrete and visual examples.
For example, students might:
- use symbols such as emojis to show how they feel
- draw pictures to represent daily activities
- use simple objects, pictures or symbols to represent information.
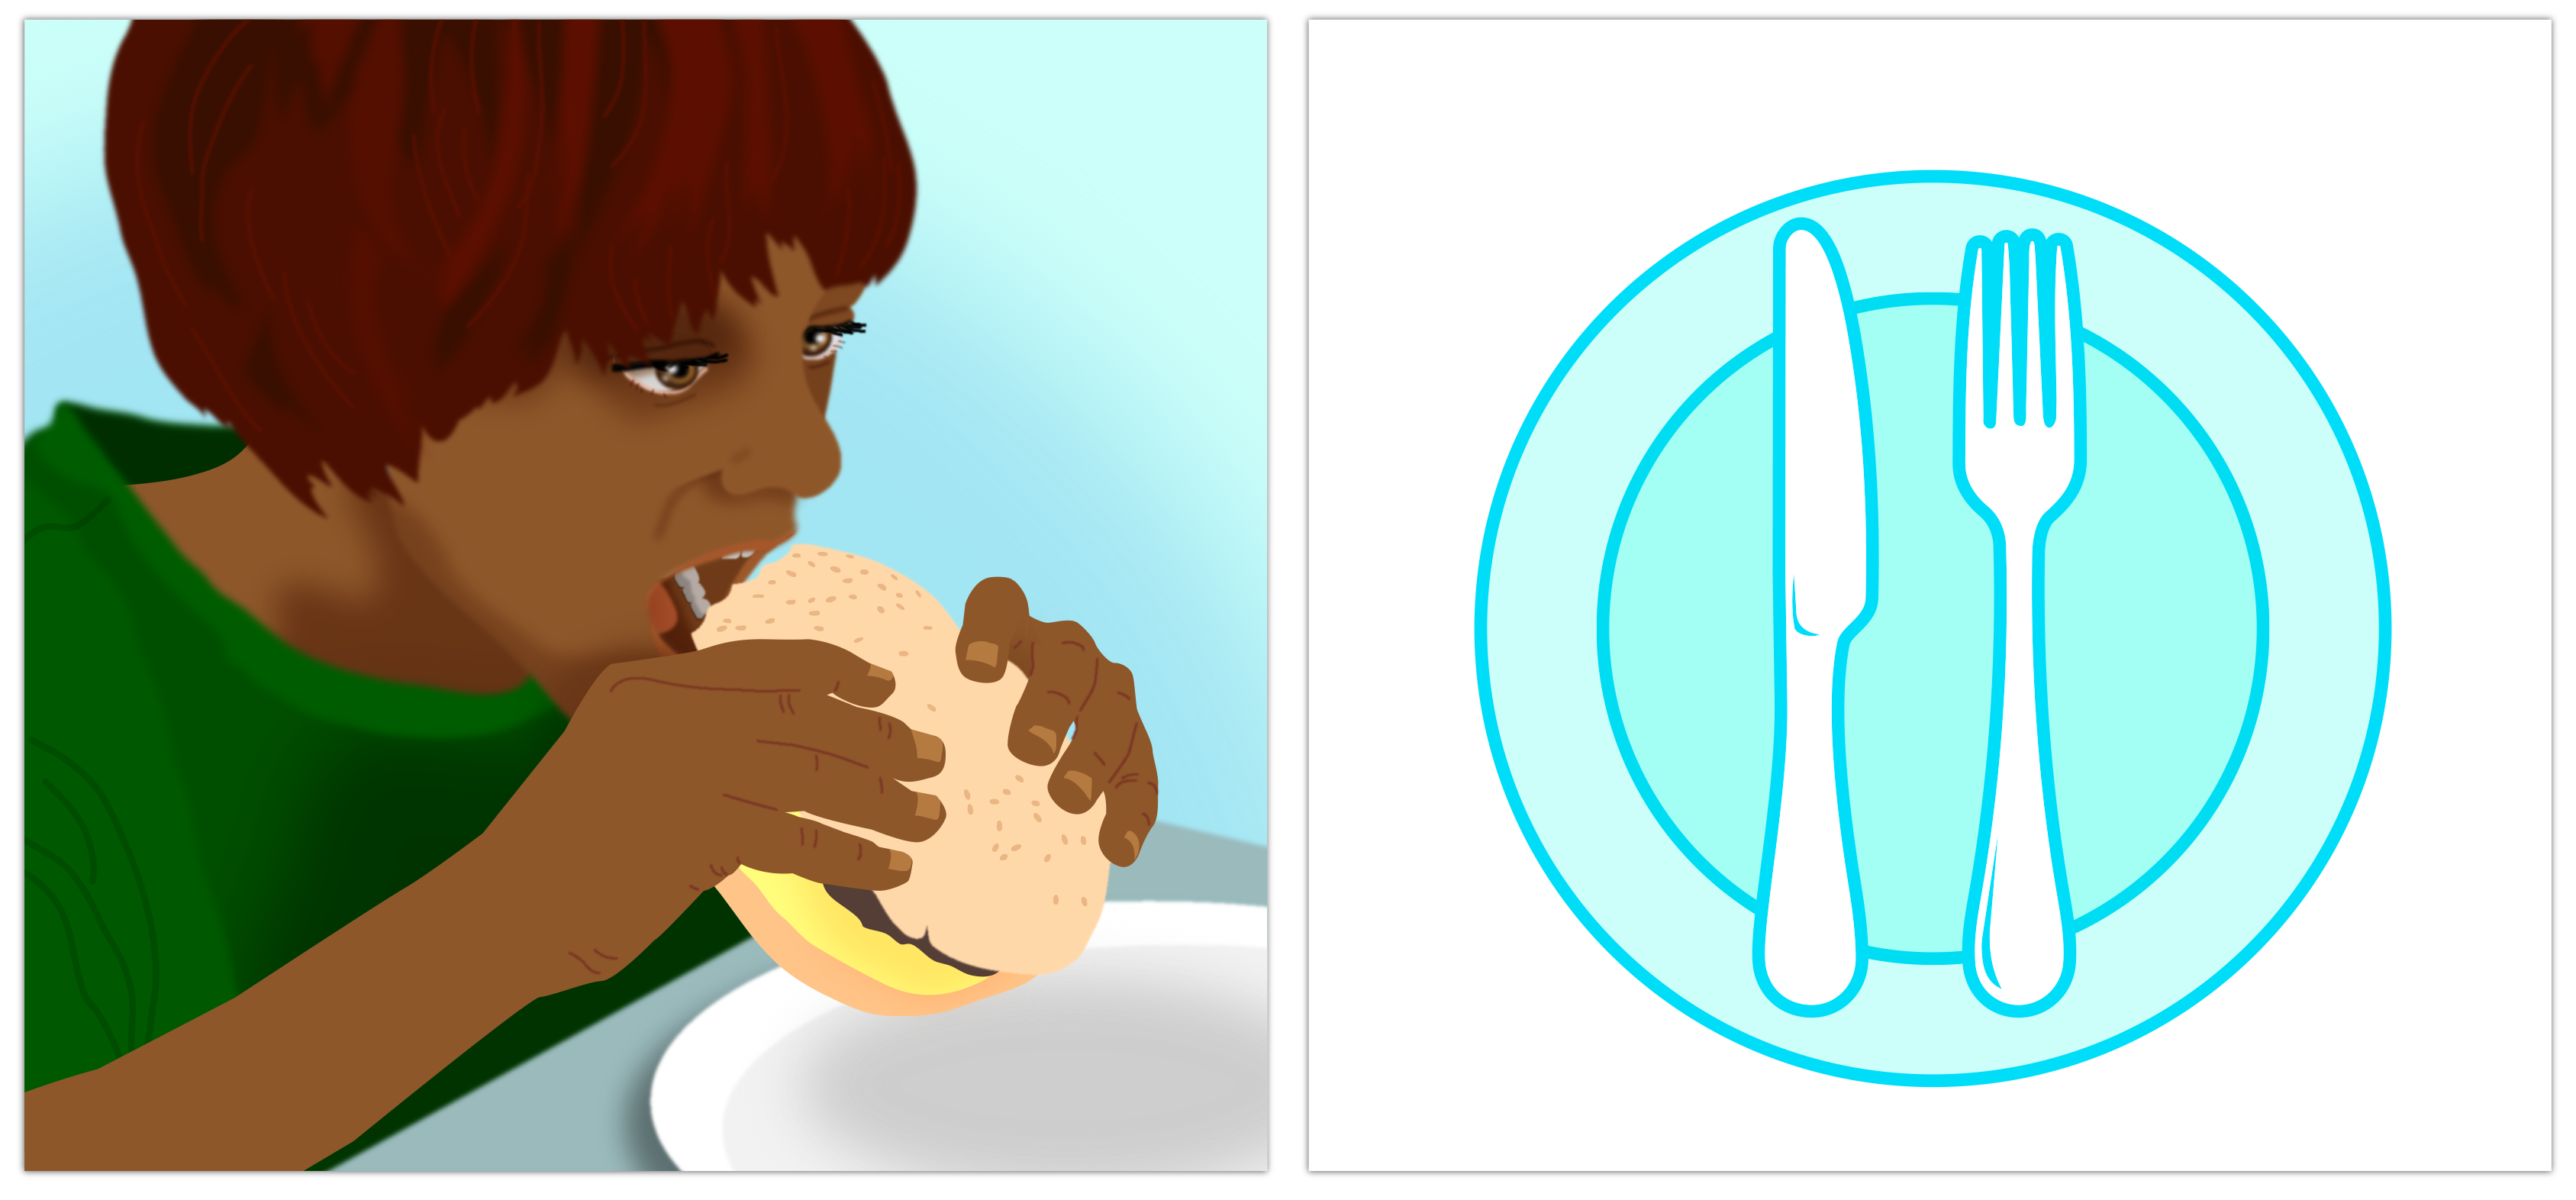
By the end of this lesson students will be able to represent ideas and events using images.
Retrieval: How would draw a picture of a person learning? What would you include? How would someone looking at your picture know it shows learning and not playing?
The features we include in a picture help people understand its meaning. Let's practise choosing features that clearly represent familiar ideas and activities.
Start with a simple activity where students represent familiar ideas using pictures.
For example:
Students draw and display pictures to represent their daily activities; for example, eating, playing or learning.
Students then talk about:
- what each picture represents
- which features of the picture – such as people, objects or actions – help others recognise the activity.
Through discussion, students notice that certain features are commonly used to help pictures be easily recognised.
This activity helps students understand that pictures can represent ideas and communicate meaning.
Evidence of learning
You might notice that students:
- use representations to communicate ideas
- identify key features that help a representation be recognised
- explain what a picture, object or symbol represents.
Common misconceptions or errors to watch for
- Not yet recognising that a picture or symbol stands for an idea. For example, focusing on the drawing itself rather than what it represents
- Confusing what a symbol means. For example, not recognising what an arrow, shape or symbol is meant to show
- Missing or unclear features in drawings. For example, leaving out important features that help others recognise what the picture represents.
Address these through modelling, questioning and discussion about what the picture or symbol represents and how it communicates meaning.
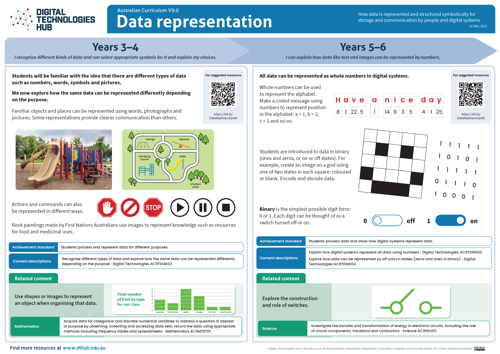
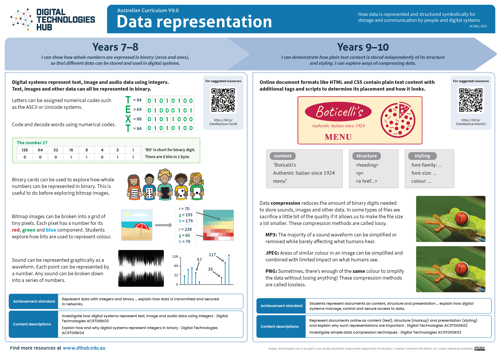
Poster: Key ideas, practical examples, Australian Curriculum
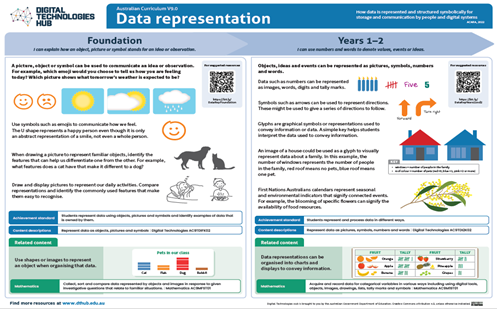
Download Data representation poster (F-2) [PDF] (opens in a new window)
Data representation in years 1–2
Expectation for this band
Students can:
- use pictures, symbols, numbers and words to represent ideas or events
- describe what a representation shows
- explain why a particular representation was chosen.
In years 1–2, students move from recognising representations, as they do in Foundation, to explaining how and why representations are used.
What this looks like in practice
Students work with simple, familiar information and represent it using pictures, symbols, numbers and words.
For example, students might:
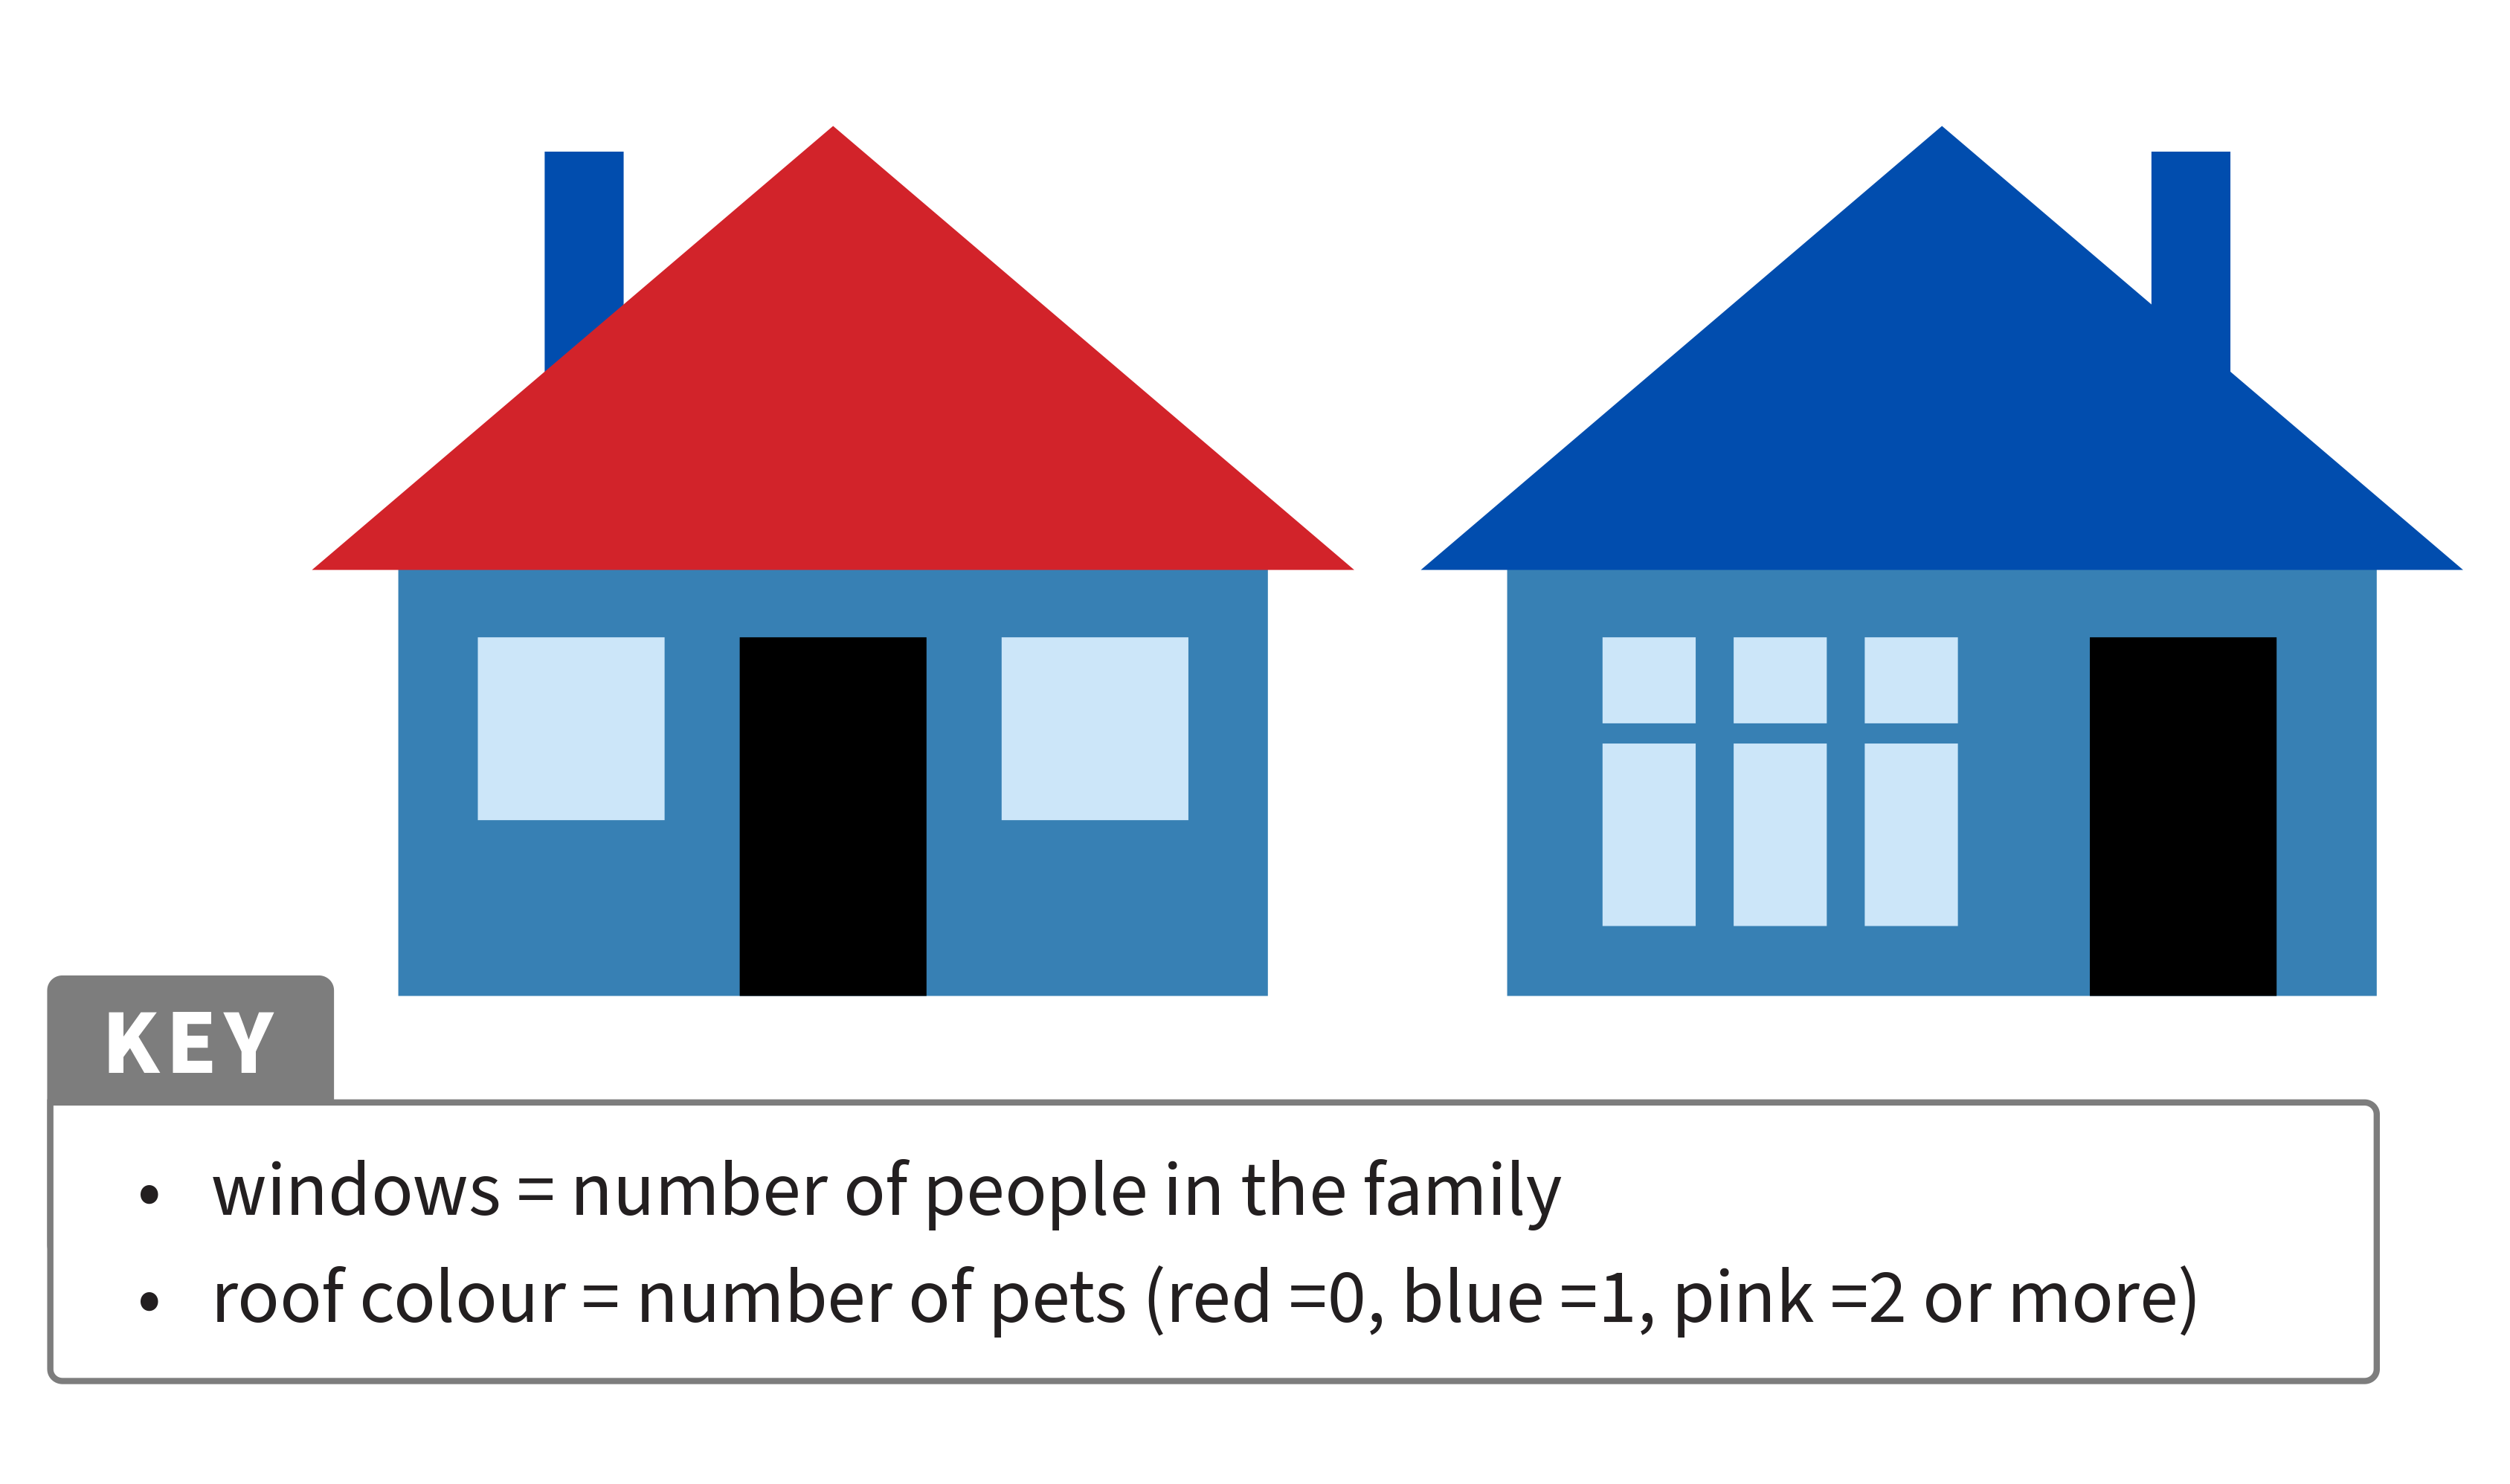
- use a glyph to visually represent information about their family; for example, drawing a house with the number of windows representing the number of people in the family
- create a simple grid map with symbols and directions
- use charts or displays in mathematics to convey information visually.
Representations are concrete, visual and connected to everyday classroom contexts.
By the end of this lesson students will be able to represent ideas and events using visual symbols.
Retrieval: What is a symbol you have seen before (for example, a toilet sign, stop sign or recycling symbol)? What information does it represent?
We know that pictures and symbols can communicate meaning. Now we'll explore how a single picture can be used to represent information about people, places or things.
Start with a simple visual symbol (glyph), then introduce a key to explain meaning. This supports students’ understanding of the glyph by gradually adding structure to this understanding.
Using glyphs to represent information
Glyphs are simple visual symbols used to represent information. A key helps students understand what each feature of the glyph represents.
Students explore a picture of a house used as a glyph to represent information about a family, for example:
- The number of windows represents the number of people in the family.
- The colour of the roof represents the number of pets that live in the house.
Students discuss:
- what each part of the picture represents
- how the key helps them interpret the information
- that the picture is showing data; it’s not just a drawing.
This helps students understand that pictures and symbols can be used to represent information, and that a key explains how to read the data.
Evidence of learning
You might notice that students:
- explain what a picture, symbol or number represents
- recognise that changing the representation does not change the data.
If students can explain what the data shows, they are developing an understanding of data representation.
Common misconceptions or errors to watch for
- Not yet recognising that a picture is a symbol with meaning. For example, students may focus on the picture of a house, rather than understanding that the picture represents information about a family
- Misinterpreting a symbol; for example, describing an arrow that points to the left as an arrow that points to the right
- Inaccurate representations; for example, drawing six candles instead of five to represent a five‑year‑old’s birthday
- Misusing tally marks; for example, by incorrectly grouping marks or incorrectly counting the tally.
Address these explicitly through modelling, questioning and discussion about what the representation shows and how it should be read.
Poster: Key ideas, practical examples, Australian Curriculum
Download Data representation poster (F-2) [PDF] (opens in a new window)
Data representation in Years 3 - 4
Expectation for this band
Students can:
- recognise different kinds of data and select appropriate representations
- understand that the same information can be represented in different ways
- explain and evaluate which type of representation communicates information most clearly for a given purpose.
In years 3–4, the focus shifts to comparing representations and understanding that the same data can be shown in different ways depending on its purpose and audience. Students begin to justify their choices and evaluate clarity, not just correctness.
What this looks like in practice
Students work with familiar data and explore multiple ways to represent the same information. For example, students:
- compare different ways of showing the same data, such as through tally charts, pictographs or simple tables
- represent familiar objects or places using words, photographs and drawings, then discuss which is easiest to understand
- explore why particular representations – such as maps, diagrams or tables – are chosen for specific purposes.
Representations are concrete and visual, but students now compare and evaluate rather than simply create.
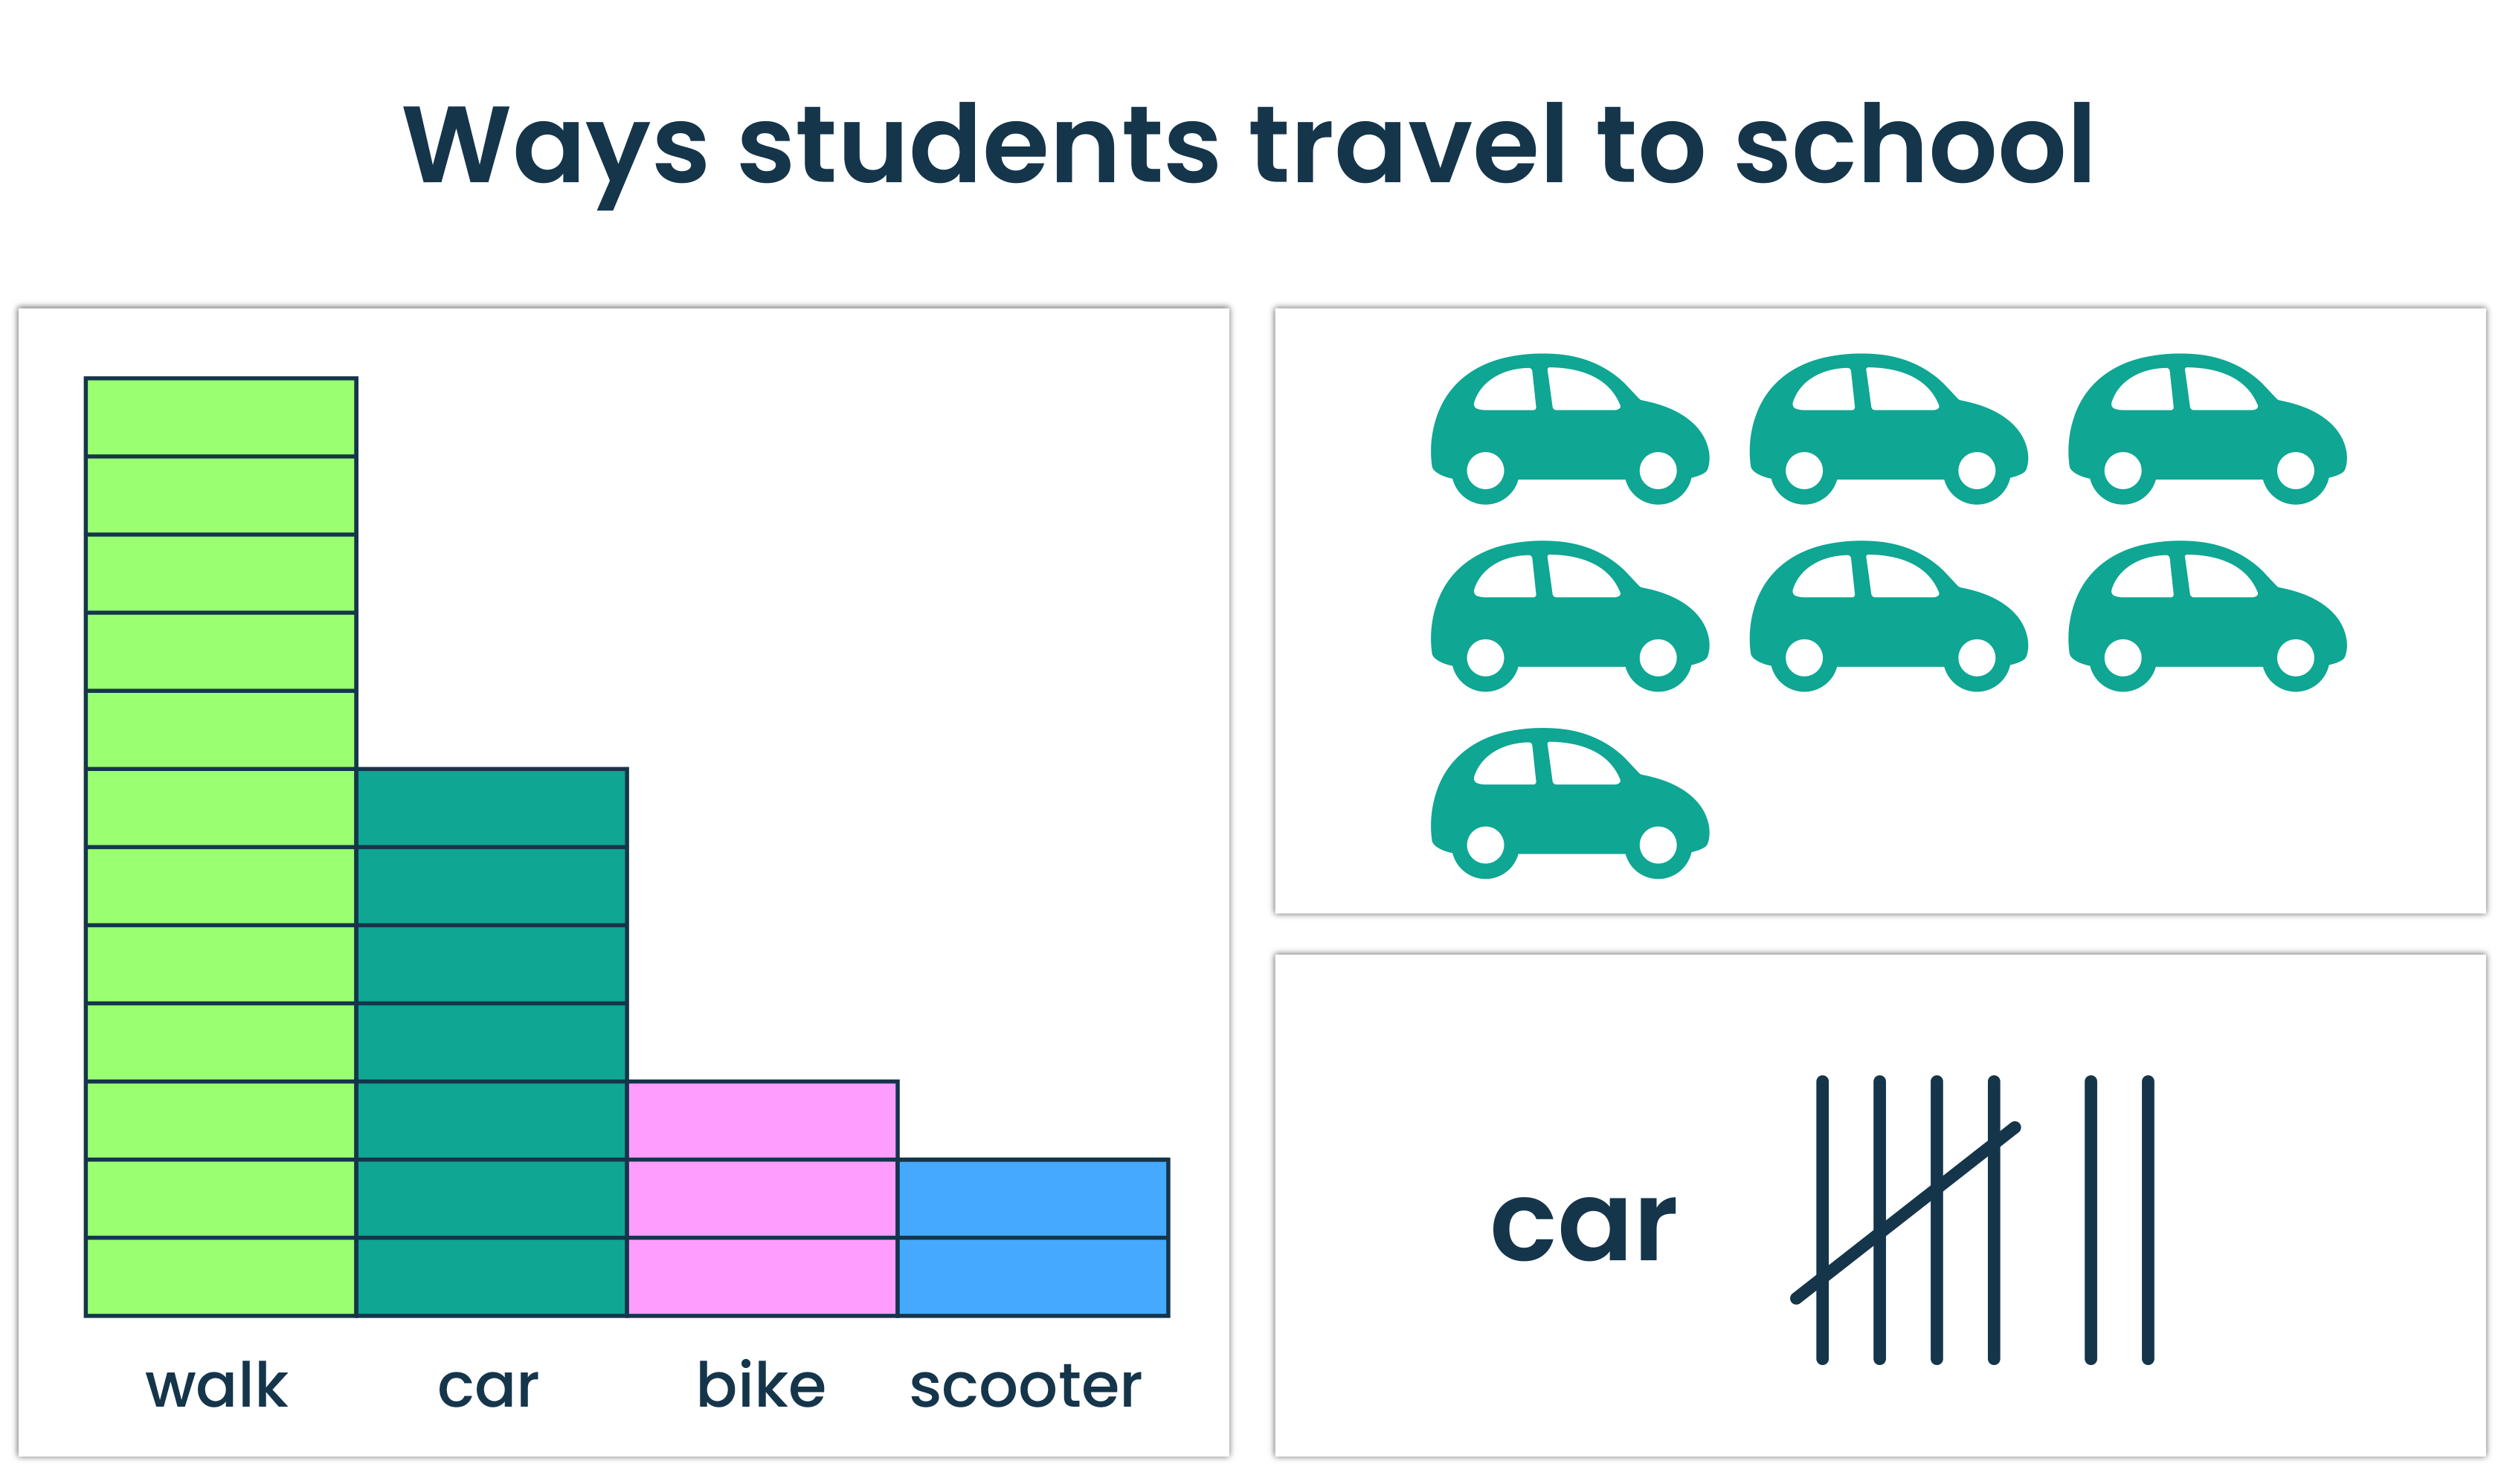
By the end of this lesson students will be able to represent class data in two different ways.
Retrieval: Why might someone choose to show data in a table instead of a graph? What are the advantages of each?
Data can be represented in different ways. Each representation shows the same information, but some make certain details easier to see than others.
Give students a small set of familiar data, such as data about how classmembers travel to school.
Students represent the same data in more than one way, for example:
- in a tally chart
- in a pictograph
- in a simple table.
Students compare the different representations. For each one, they discuss:
- What information does this representation show clearly?
- What information is harder to see in this representation?
They then discuss which representation would be most useful for different purposes; for example, counting totals or comparing categories.
Through this discussion, students recognise that the data has not changed, only the way it is represented. This helps them understand that the same information can be communicated in different ways, depending on purpose.
Evidence of learning
You might notice that students:
- explain what information a representation shows
- recognise that the same data can be represented in different ways
- compare representations and explain which one communicates a given set of data most clearly.
If students can justify why one representation works better than another for a given purpose, they are developing a strong understanding of data representation.
Common misconceptions or errors to watch for
- Assuming one representation is always ‘better’ without considering its purpose; for example, choosing a pictograph to show totals because it looks appealing, even when a table would show the totals more clearly
- Confusing decoration with data; for example, adding pictures that do not represent information
- Misreading symbols or scales; for example, misunderstanding what a symbol represents in a pictograph
- Believing that changing the representation changes the data.
Address these through modelling, questioning and comparison of multiple representations of the same data.
Data representation Years 5 - 6
Expectation for this band
Students can:
- describe ways that data can be represented using whole numbers
- explain how binary (ones and zeros, on/off states) represents information in digital systems
- represent simple images using grids of pixels, where each square is on (1) or off (0).
In years 5–6, the focus shifts from how data can be shown to how computers represent data, prompting students to move from asking ‘How can we show data?’ to ‘How do computers show data?’
What this looks like in practice
Students explore how information is represented in digital form using numbers, basic binary values (zero and one) and pixel‑based images. Learning builds on students’ experiences of creating visual and concrete representations, and they increasingly link these representations to how computers work.
For example, students might:
- use numbers to represent letters or symbols in a simple code such as 1 = A, 2 = B, 3 = C
- create images using grids of squares that are either on or off
- explore how text or small images can be represented using binary values.
Students focus on understanding the idea behind the representation, rather than memorising notation.
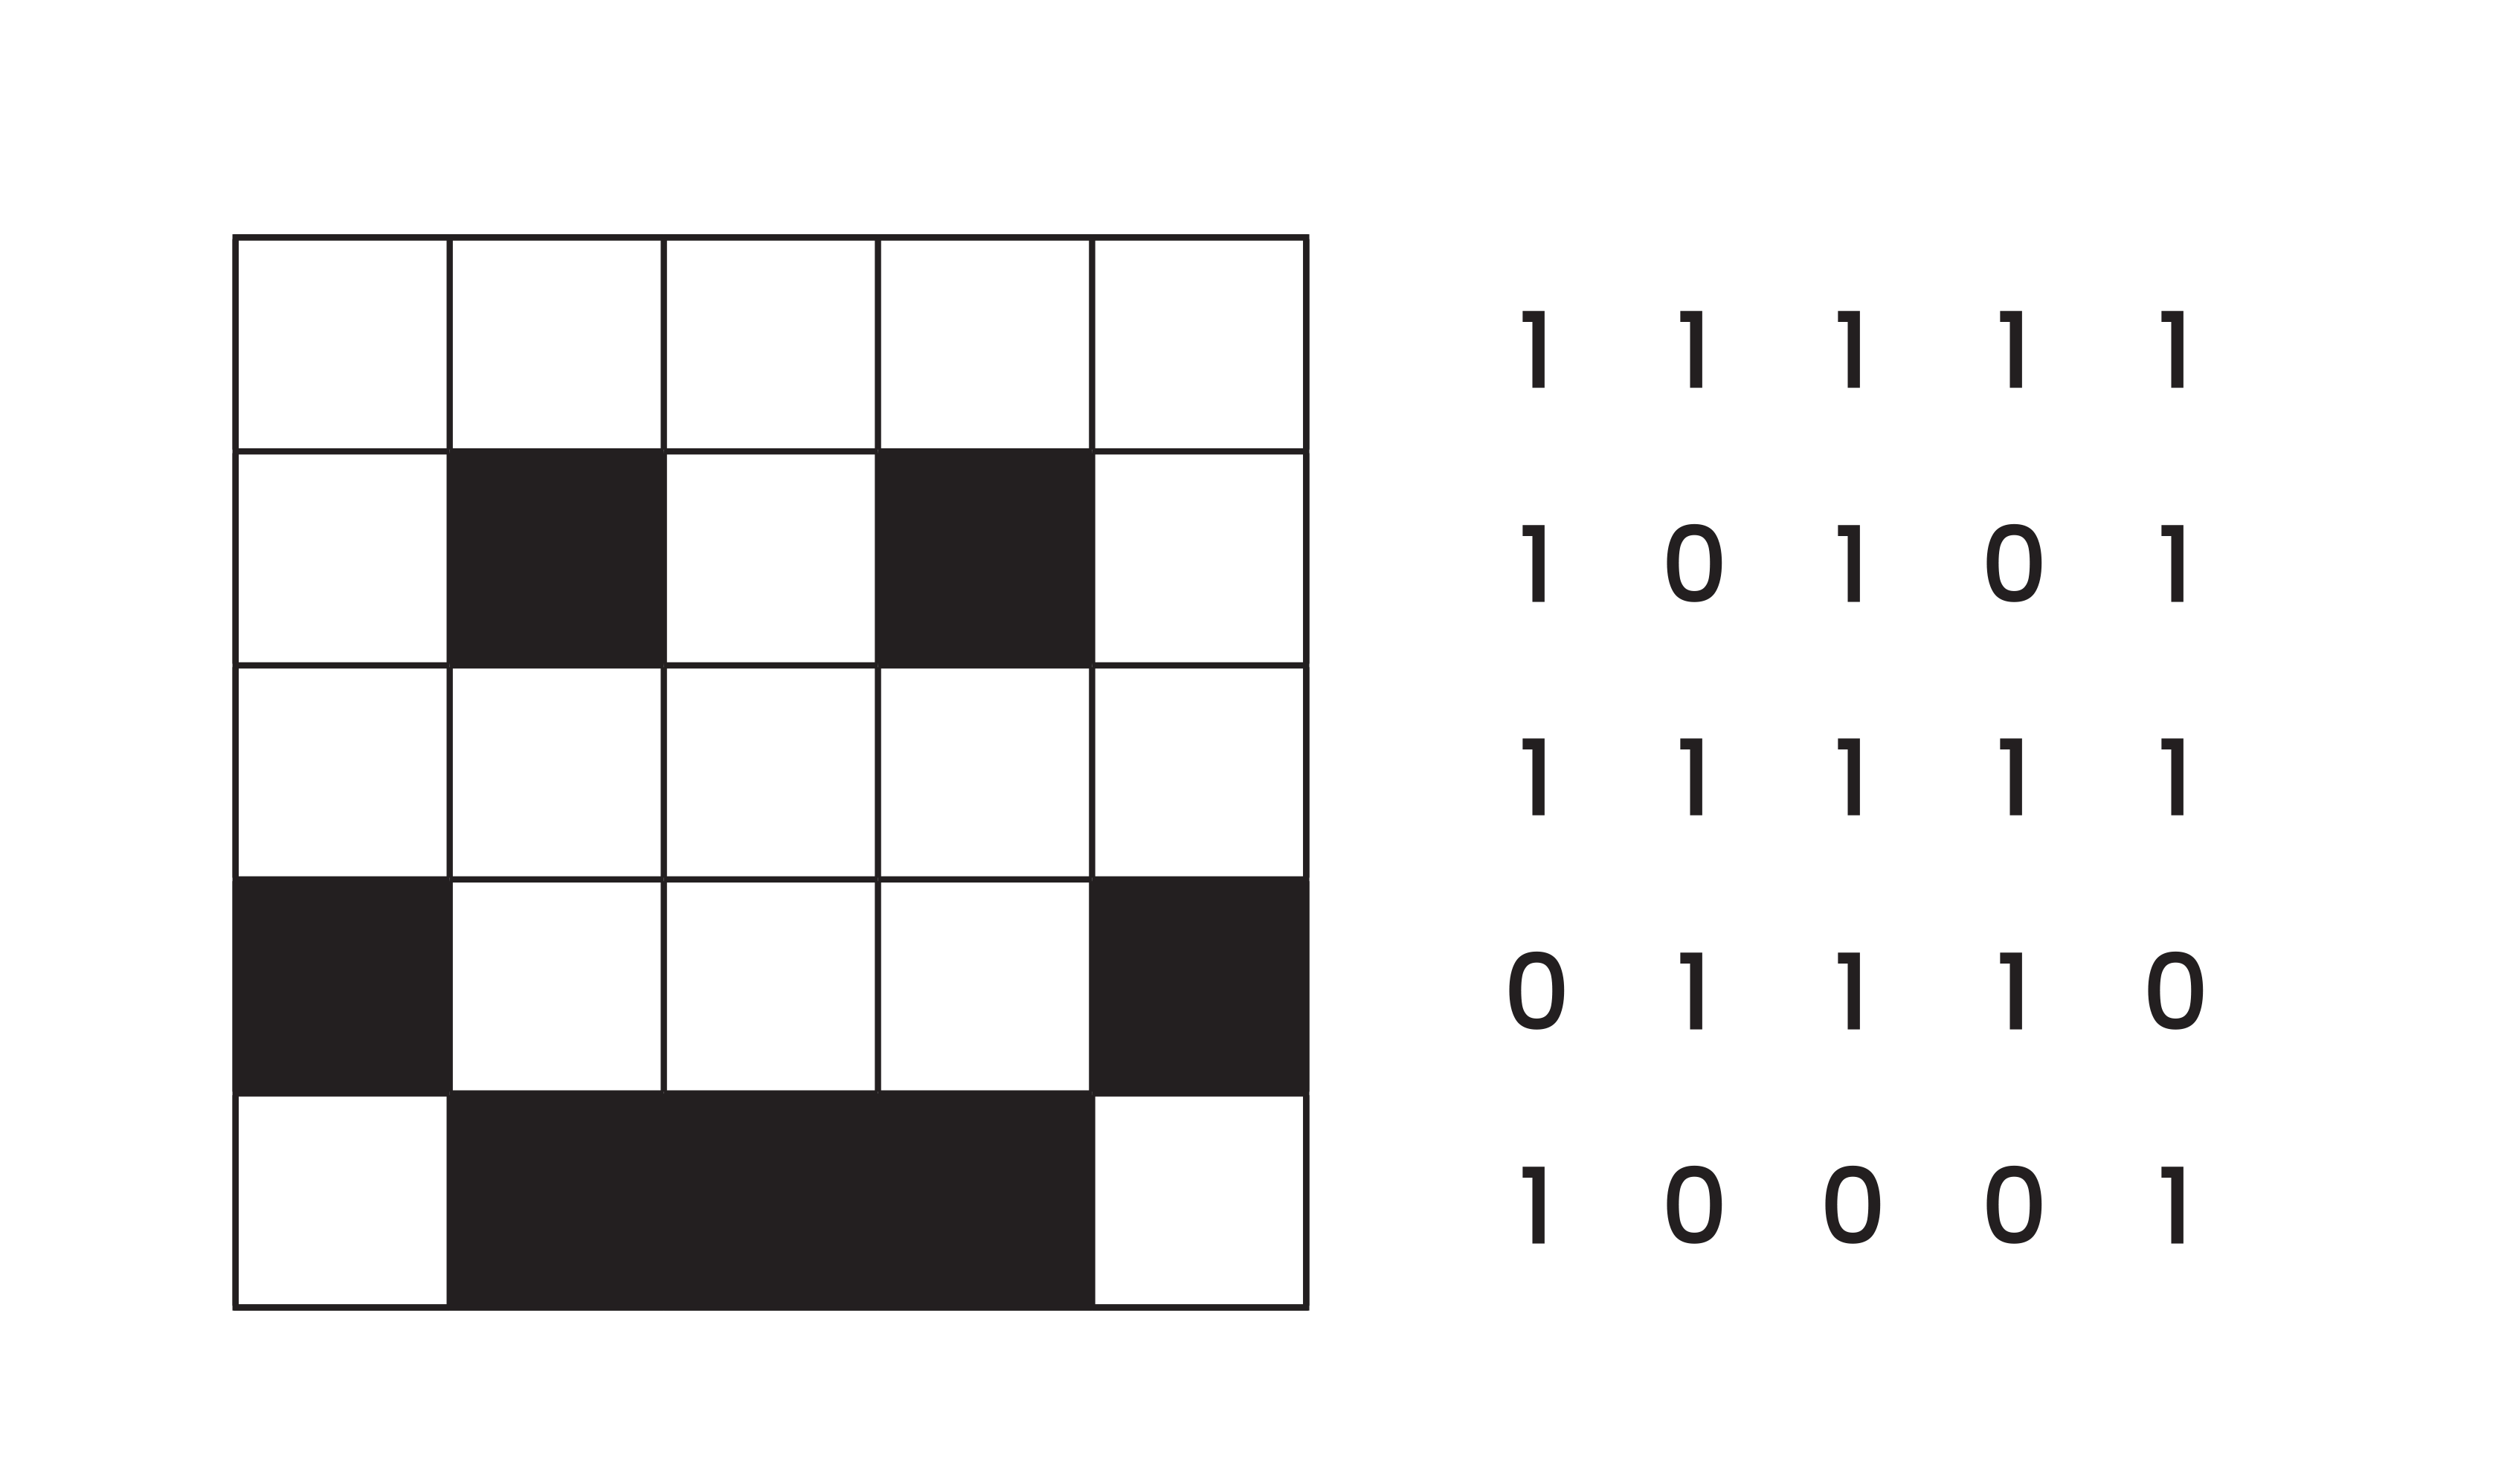
By the end of this lesson students will be able to represent data using ones and zeros.
Retrieval: How can a collection of dots or squares be used to make an image we can recognise?
A picture may look whole to us, but digital images are made from many individual pixels. Let's explore how pixels can be represented using only two states: on and off.
Students create a simple pixel picture of a familiar object or animal using a grid.
Each square in the grid represents a pixel and can be either:
- on (1) – shown as white
- off (0) – shown as black.
Students record the image as:
- a visual grid
- a sequence of 1s and 0s representing each row.
Students discuss:
- how the image changes when a single pixel is switched on or off
- how a picture can be represented using numbers
- that digital systems store images as combinations of two states.
Through this activity, students recognise that images are made from data, and that binary states can be used to represent visual information.
Evidence of learning
You might notice that students:
- explain how numbers or binary values represent information
- correctly use on/off states to represent simple images
- describe how changing a pixel changes the image, but not the underlying idea.
If students can explain how digital systems use numbers and binary states to represent images or text, they are developing a suitable level of understanding of data representation.
Common misconceptions or errors to watch for
- Thinking binary is only used for numbers, not images or text
- Believe that binary image values have fixed meanings, such as 1 always representing white and 0 always representing black, rather than understanding that the mapping can be defined in different ways depending on the system or convention being used
- Confusing the visual image with how it is stored digitally
- Inconsistently applying on/off values when representing pixels.
Address these through modelling, unplugged activities and discussion that links visual representations to their numeric or binary form.
Poster: Key ideas, practical examples, Australian Curriculum
Download Data representation poster (years 3-6) [PDF]
Data representation in years 7–8
Expectation for this band
Students can:
- demonstrate how whole numbers (integers) are represented in binary (sequences of zeros and ones) in digital systems
- explain how different types of data, such as text, images and sound, are encoded using binary
- represent simple images using pixels and binary values
- convert small decimal numbers to binary and back.
In years 7–8, the focus is on understanding that all data in digital systems is represented using binary, regardless of whether it appears as numbers, text, images or sound. Students move from using binary representations to explaining how and why digital systems use them.
Key terms in the curriculum
| Encoding | Changing information into a different form so it can be stored, processed or transmitted by a digital system. |
|---|---|
| Decoding | Changing encoded information back into a form that people can understand. |
| Encoding | Representing the letter A as a number or a sequence of binary digits. |
|---|---|
| Decoding | Interpreting a sequence of binary digits back into the letter A. |
What this looks like in practice
Students explore how a range of data types are represented using binary values. Activities combine visual models, unplugged experiences and simple digital tools to make abstract ideas concrete.
For example, students might:
- use binary cards to represent whole numbers and explore how integers are stored in computers
- create or modify pixel images where colour values are represented using binary (such as RGB values), either on paper or with a digital tool
- encode and decode text using a simple binary code, such as ASCII
- represent sound graphically as a waveform and discuss how sound can be stored digitally.
Students focus on recognising patterns and relationships.
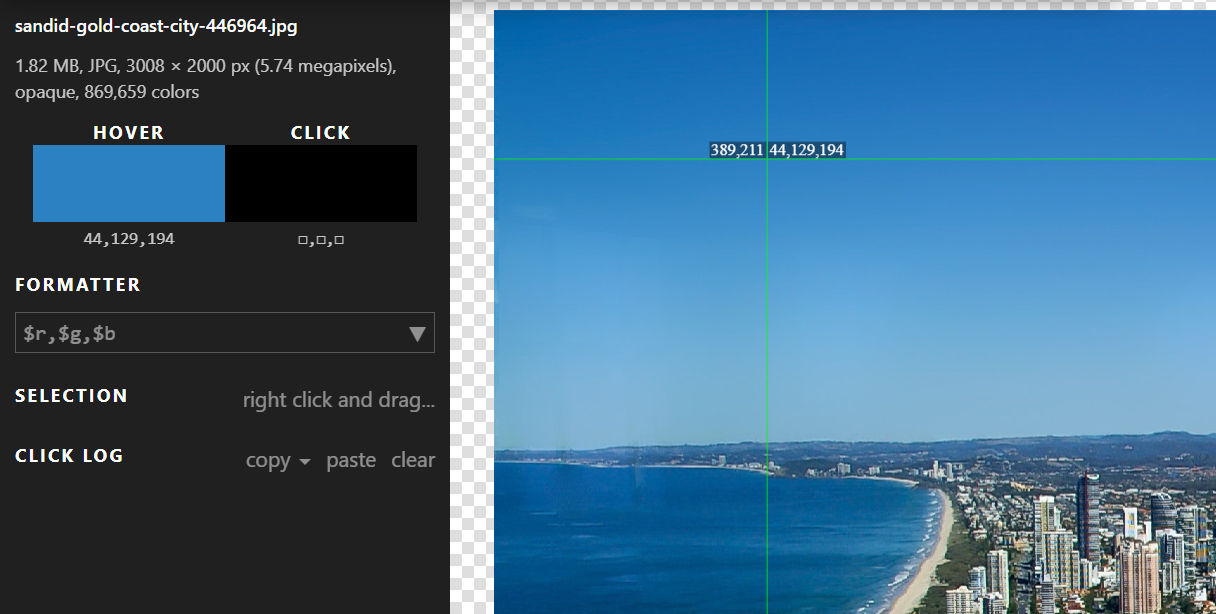
Image: Screenshot of a colour-picker tool analysing a landscape photo. Crosshair guides select a point in the blue sky above dark mountains and water, while a panel on the left displays the RGB colour values of the selected pixel (RGB 44,129,194).
By the end of this lesson students will be able to explain how digital colour images are represented using three values red, green and blue.
Retrieval: A black-and-white image uses pixels that can be either on or off. What extra information might a computer need to store a colour image?
Black-and-white images can be represented using just two states, but colour images need more information. Computers represent colour by storing three values for each pixel: red, green and blue.
Students explore how colour images are represented in digital systems using pixels and colour values.
Students work with a small digital image made up of coloured pixels. Each pixel is represented using three values, Red, Green and Blue (RGB).
Students:
- observe the RGB values of individual pixels in an image
- record pixel colours as sets of numbers. So, for example, the pixel R = 2, G = 84, B = 142, would become:
- R = 2 = 00000010
- G = 84 = 01010100
- B = 142 = 10001110
- This one pixel would be stored in the computer as: 000000100101010010001110
- modify RGB values to see how these changes affect the colour of a pixel
- compare black‑and‑white images with colour images and discuss what additional data is required to make colour images.
Students discuss:
- how colour images are made from numbers
- how each colour pixel stores more information than a black‑and‑white pixel
- how digital systems use integers to represent images.
Through this activity, students recognise that colour images are built from data, and that digital systems represent images using numeric values for each pixel.
Evidence of learning
You might notice that students:
- explain that a black-and-white image represents each pixel as on or off, while a colour image represents each pixel using RGB values
- correctly convert between small decimal numbers and binary
- explain how integers are represented using binary place values
- describe how text, images or sound are encoded using binary
- make connections between different data types and their binary representations.
If students can explain how different data types (such as text, images and sound) are encoded using the same binary system, they are demonstrating a suitable understanding of data representation.
Common misconceptions or errors to watch for
- Confusing visual representations, such as images or waveforms, with how the data is stored digitally
- Applying conversion rules without understanding place value
- Assuming binary is only used for numbers, not text, images or sound.
Address these through modelling, visual representations and repeated linking between concrete examples and binary encoding.
Data representation in years 9-10
Expectation for this band
Students can:
- demonstrate how digital content can be stored separately from its presentation and styling
- describe how plain text formats, such as HTML and CSS, structure and display digital content
- explain how data compression reduces file size by representing data more efficiently
- distinguish between lossy and lossless compression and explain their different uses
- evaluate trade‑offs between file size, quality and purpose when selecting compression methods.
In years 9–10, the focus is on understanding that how data is represented affects the efficiency, quality and use of representations. Students examine how digital systems separate content from presentation and make deliberate choices about how data is stored, displayed and compressed.
Key terms in the curriculum
| Data compression | Reducing the size of data so it uses less storage or can be shared more efficiently. |
|---|---|
| Data presentation | The way data looks as opposed to how it is stored or represented. On webpages, data presentation (using HTML and CSS) is separate from how data is stored or represented. |
| Data compression | Data size can be reduced by removing unnecessary information or by representing data more efficiently. In a JPEG image, for example, compression reduces file size by reducing the amount of data used to represent the image, which can affect image quality. Compression can be:
|
|---|---|
| Data presentation | On web pages, data presentation (using HTML and CSS) is separate from how data is stored or represented. For example, a dataset containing book purchasing details (such as title, author, price, and quantity in stock) may be stored in a spreadsheet or database. However, when this data is displayed on a webpage, HTML structures it into headings, paragraphs or tables, while CSS controls the layout, spacing, colours and font styles. The underlying data remains unchanged. Only the way the information is presented to the user is different. |
What this looks like in practice
Students explore how representation decisions influence the way digital content is displayed and stored. Activities emphasise comparison, evaluation and justification rather than simply creating representations.
For example, students might:
- create or edit a simple webpage using HTML and CSS to explore how content, structure and styling are stored separately
- compare compressed and uncompressed image or sound files to observe differences in file size and quality
- modify image or sound files to explore how reducing data affects quality and usability
- discuss why different compression methods are chosen for different purposes, such as for web images, archival files or streaming media.
Students are encouraged to explain why a representation or compression choice is appropriate for a given context.

By the end of this lesson students will be able to explain the effect on quality of images and audio files by different compression techniques.
Retrieval: Why might someone choose a lower-quality image or audio file instead of the highest-quality version available?
Reducing a file's size can make it easier to store, share and transmit, but this may affect quality. In this lesson, we will explore how different compression techniques involve trade-offs between file size and fidelity.
Students work with a digital image or sound file and create multiple versions using different compression settings.
Students:
- compare file sizes and quality across multiple compressed versions
- observe changes in quality
- identify whether compression is lossy or lossless
- explain how the purpose of the file influences which version is most suitable
- select the most appropriate version for a given purpose and justify their choice.
Students discuss:
- what information is removed or preserved during compression
- how compression affects storage, transmission and user experience
- why a smaller file size may reduce quality and affect how the file can be used.
Through this activity, students recognise that digital representations are designed for particular purposes and involve trade-offs between file size, quality, storage requirements and ease of transmission
Evidence of learning
You might notice that students:
- explain how content and presentation are stored separately in digital systems
- describe how compression reduces file size and why this is useful
- distinguish between lossy and lossless compression, using appropriate examples
- justify representation and compression choices based on purpose and context.
If students can evaluate and justify trade‑offs between file size, quality and purpose, they are demonstrating a suitable understanding of data representation.
Common misconceptions or errors to watch for
- Assuming all compression works the same way
- Believing that compression only affects file size, not quality
- Confusing presentation (appearance) with the underlying data
- Selecting compression methods without considering purpose or audience.
Address these through comparison tasks, explicit discussion of trade‑offs, and opportunities for students to explain their decisions.
Poster: Key ideas, practical examples, Australian Curriculum
Download Data representation poster (7-10 [PDF] (opens in a new window)
Plan your teaching
Explore sample units and lessons.
These sample units show how data representation can be taught as a short sequence or extended unit at each year level.
Foundation: Representing data
Years 1–2: Ways we represent data
Years 3–4: Using data purposefully
Years 5–6: Representing data in digital systems
Years 7–8: Binary numbers
Years 9–10: Webpage design, Coding - Compression, Seeing the pig picture
Use this planning template (opens docx in a new window) to record relevant information as you view a scope and sequence topic for your year level.
Research-informed teaching
Evidence-based approaches
- Unplugged learning (familiar routines and examples)
- Semantic waves (concrete to abstract learning)
- Dual coding (visual and verbal)
- Worked examples with gradually reduced scaffolding
- Culturally responsive pedagogies
Unplugged learning
Research from CS Unplugged shows that introducing computing concepts without devices helps students focus on core ideas before adding technical complexity.
What this looks like in practice
- Begin with a visible or tangible representation, such as objects, images, symbols or simple grids.
- Use everyday language to describe what the representation shows before introducing formal terms.
- Focus discussion on how information is represented, not how it is processed.
- Use physical or visual models to show that digital systems represent information using simple, consistent units.
- Introduce formal concepts, such as binary or pixels, after students understand the underlying idea.
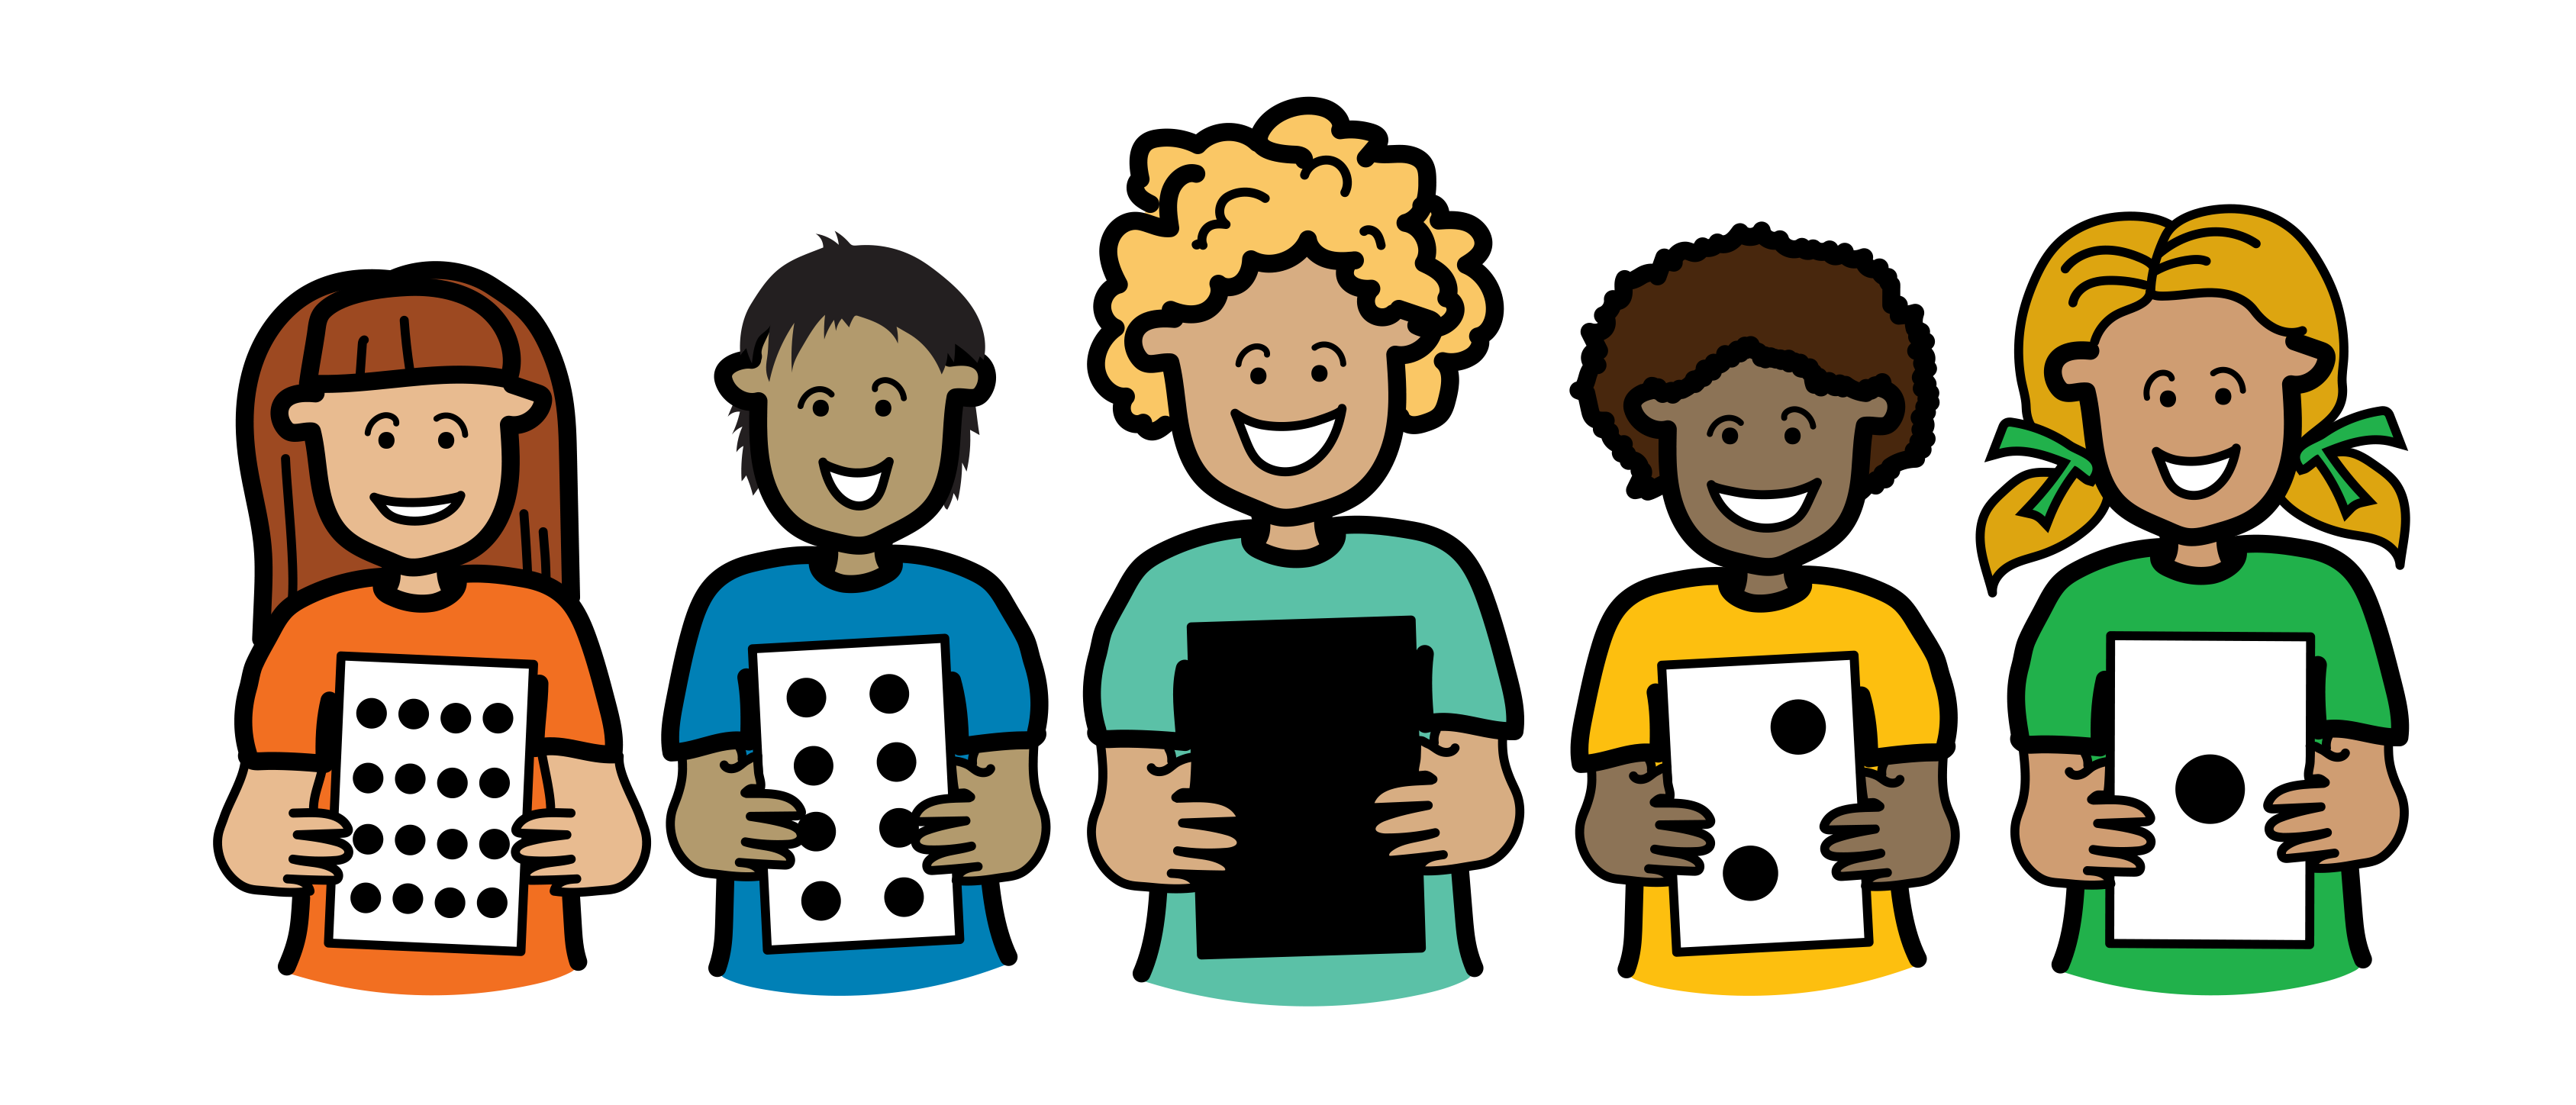
This activity is for years 7–8. Students use a set of binary cards, where each card represents a value; for example, 1, 2, 4, 8, 16, 32, 64, 128.
- Cards are flipped on or off to represent binary states.
- Students combine cards to build whole numbers.
- The class discusses how changing one card changes the total value.
Through this activity, students see that:
- binary uses only two states
- whole numbers can be built from combinations of these states
- digital systems represent integers using the same principle.
This unplugged approach helps students understand how binary digits work before they encounter binary notation or digital systems.
Semantic waves
Research from the National Centre for Computing Education shows that students understand abstract ideas more deeply when teachers deliberately move between everyday examples and formal terminology.
What this looks like in practice
- Start with a visible, concrete example such as a black-and-white grid image.
- Ask students what they notice; for example, in the grid, each square is either black or white.
- Introduce formal terms such as pixel, binary or representation.
- Revisit the image and describe it using computing vocabulary.
Example
Students view a simple black-and-white image made from a grid of squares. Each square is either black or white. The teacher explains that each square is a pixel, and that digital systems store this information using two possible values (0 and 1). Black and white can therefore be represented in binary as two states.
Learn more about semantic waves (opens external website in a new window) [PDF]
Dual coding
Research synthesised by Richard E Mayer shows that students learn new concepts more effectively when information is presented using both words and visuals, reducing cognitive load and supporting deeper understanding.
What this looks like in practice
- Present new concepts using both spoken or written explanations and visual representations.
- Use diagrams, images, symbols or simple models alongside verbal descriptions.
- Explicitly link the visual elements to the language being used.
- Revisit the concept using both modes together to reinforce understanding.
Example
When introducing data representation, the teacher shows students a simple black-and-white grid image while explaining that each square is a pixel. Students hear terms such as pixel, binary and state, while seeing the black and white squares mapped to 0s and 1s. Students refer to both the visual grid and the verbal explanation when describing how digital systems use simple states to represent images.
Worked examples with gradually reduced scaffolding
Research synthesised by the Australian Education Research Organisation shows that modelling worked examples and gradually reducing support improves learning of complex procedures.
What this looks like in practice
- Model a complete example before asking students to work independently.
- Make the thinking process explicit by explaining decisions and steps as they occur.
- Provide structured support such as prompts, templates or partially completed examples.
- Gradually remove scaffolds as students gain confidence and competence.
Example
The teacher works through representing a simple image as binary data with the class.
- Step 1: The teacher shows students a fully completed example; in this case, a small black-and-white grid with each square labelled 0 (white) or 1 (black). The teacher explains each choice explicitly.
- Step 2: The teacher provides a partially completed grid. Students fill in missing binary values with the teacher’s guidance. The completed grid should reveal a recognisable image.
- Step 3: Students independently represent new images in binary, applying the same process without prompts or scaffolds.
This approach ensures students understand how abstract concepts like pixels and binary states map to concrete examples, before applying the ideas independently.
Culturally responsive pedagogies
Culturally responsive pedagogies recognise and value students’ cultural identities, experiences and ways of knowing, and use these as a foundation for learning.
What this looks like in practice
- Broaden learning contexts beyond common classroom examples by drawing on culturally diverse games, stories and real‑world systems, and on texts created by authors from different cultural backgrounds.
- Select examples that reflect the different cultural backgrounds, experiences and communities represented in your classroom.
- Where possible, co-design activities with local communities or source learning materials created by First Nations authors and knowledge holders.
- Ensure cultural examples are used respectfully and purposefully to support learning.
Example
Students explore data representation using a pixel‑style artwork created by a First Nations artist and shared with permission. The class discusses how images can be simplified into basic shapes and patterns, and how a grid of squares can be used to represent an image. Students are invited to consider an Australian animal connected to the local area and think about the simplest features needed to recognise it. Using a grid, students create a simple black‑and‑white pixel image of their chosen animal. This activity supports discussion about how digital systems represent images using structured, repeatable units, while acknowledging the cultural origins and creative process of the original artwork.
Important guidance:
- Share cultural examples respectfully. Totems and kinship hold deep cultural meaning for First Nations Australians and should be treated with respect. Students are not asked to copy a First Nations artist’s work, but to create their own pixel‑style images while acknowledging cultural ownership and the significance of connections to Country and kin.
- Where possible, co-design activities with local communities or source them from First Nations-led resources.
Check understanding
- Foundation: Work sample
- 1–2: Work sample
- 3–4: Work sample
- 5–6: Binary and pixel rubric
- 7-8: Pixels and binary digits task
- 9–10: Data compression
Teachers can assess student learning in a range of ways, including through checklists, observations, rubrics and student work samples.
- Foundation: Data is all around us. (opens external website in a new window) Use this work sample to assess students’ understanding of representing data using digital systems.
- Years 1–2: Organising ideas: My school. (opens external website in a new window) Use this work sample to assess students’ knowledge and skills related to representing and processing data in different ways.
- Years 3–4: Clean our school. (opens external website in a new window) Use this work sample as a guide to assessing students’ knowledge and skills related to representing and processing data in different ways.
- Years 5–6: Data representation. Use the assessment rubric from this unit to assess students’ understanding of binary and encoding/decoding, and their pixel art creativity.
- Years 7–8: Pixels and binary digits assessment. In this assessment, students explain how images are made up of binary digits and represent eight colours using binary.
- Years 9–10: Data compression. Use this resource to assess students’ knowledge of how pixel information can be manipulated by reducing file size and of the trade-offs between pixel counts and image quality.
Deepen your understanding
Explore these resources to help teach about data representation in digital systems:
- Representation of numbers: explains how to convert integers to binary
- Representation of text: explains how letters, numbers and symbols are stored
- Representation of sound: explains how sounds are represented digitally
- Compression: explains techniques that reduce file size