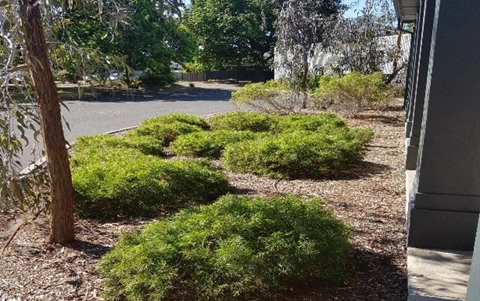
Schoolyard biodiversity detectives
Collect data on the biodiversity in garden beds around your school to measure the biodiversity (that is the different types of plants and animals). Explore ways to represent and present data. This lesson was devised by Linda McIver, Australian Data Science Education Institute.
Additional details
| Year band(s) | Foundation, 1-2, 3-4 |
|---|---|
| Content type | Lesson ideas |
| Format | Web page |
| Core and overarching concepts | Data acquisition, Data representation |
| Australian Curriculum Digital Technologies code(s) |
AC9TDIFK02
Represent data as objects, pictures and symbols
AC9TDI2K02
Represent data as pictures, symbols, numbers and words
AC9TDI4P01
Define problems with given design criteria and by co-creating user stories |
| Keywords | Biodiversity, Science, Mathematics, Data, Tables, Graphs, Data representation, inclusive education, disability, disabilities |
| Integrated, cross-curriculum, special needs | Science, Mathematics, Digital Literacy, STEM |
| Organisation | ESA |
| Copyright | Creative Commons Attribution 4.0, unless otherwise indicated. |
Related resources
-
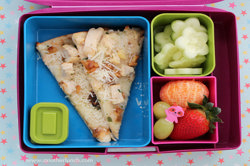
Acquiring data and representation: What’s in your lunchbox?
The type of fruits and vegetables in school lunchboxes or those eaten at crunch and sip or fruit break time can provide a good source of data for a classroom investigation.
-
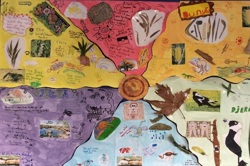
Classroom ideas F-10: Aboriginal and Torres Strait Islander connections to Digital Technologies
This resource provides examples of ways Aboriginal and Torres Strait Islander Histories and Cultures can be integrated into Digital Technologies. Examples include 'classification and sorting data' and 'designing solutions'.
-
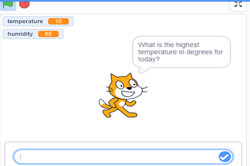
Visual programming with Scratch (Years 3-6)
This resource comprises a collection of sample activities that incorporate visual programming (Scratch) into teaching and learning programs.
-
Robots, data and computational thinking (Years 2-4)
This classroom resource comprises four worksheets to accompany a lesson on data and computational thinking. These materials are designed for teachers to use simple line-following robots (Ozobots) to engage students in the computational thinking process and working with data.
-
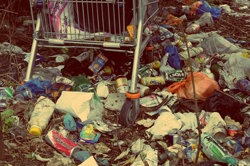
Collecting data about litter in the community (Years 3-4)
The litter students find in the local environment can provide a good source of data. The interpretation of this data can help students answer a range of inquiry questions.
-
Data interpretation: organise data by classifying, grouping and sorting objects
To sort and classify familiar objects, students use computational thinking skills to organise data in a logical way.
-
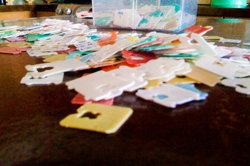
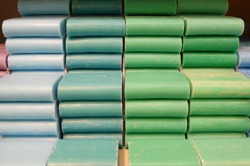
Exploring patterns and data with bread tags and plastic lids (Years 1-2)
In Digital Technologies, manipulatives/ concrete materials/ loose parts such as bread tags and lids can be used to learn more about data.
-
Data representation
Ideas for teaching about patterns in data, representing data as pictures, symbols and diagrams as well as ideas for teaching about collecting, sorting and using digital systems to present data.