About this lesson
Explore ways to model, interpret, represent and present data, creating an infographic to raise awareness about turtle conservation.
Year band: 5-6, 7-8
Curriculum Links AssessmentLearning hook
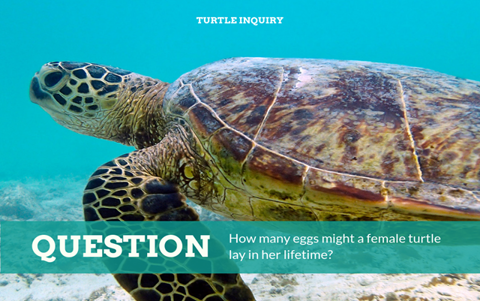
The number of eggs a female turtle lays in her lifetime influences the health of that species population. In this lesson we look at modelling data related to the number of eggs a female turtle lays in her lifetime, using real scientific data. Explore ways to model, interpret, represent and present data, creating an infographic to raise awareness about turtle conservation.
This lesson was created and developed in partnership with with Pawsey Supercomputing Centre and Western Australian Marine Science Institution (WAMSI) Kimberley Marine Research Program.. Turtle data was sourced from the WAMSI project, which is funded by the Western Australian State Government and research partners. Data is licensed under the Creative Commons BY-NC-SA 2.5 AU licence.
Suggested steps
Step 1
Use a quiz to stimulate interest in marine turtles and discussion of some key concepts.
Step 2
Use a suitable learning hook to engage students in analysing and interpreting real data about marine turtles. Here are some ideas:
- Share experiences of observing turtles when holidaying or visiting museums or aquariums.
- Use a relevant resource such as Marine turtles in Australia to show images of different turtle species. Discuss what students know about turtle habitats, conservation status (vulnerable/endangered) and the cultural and social values of turtles for Aboriginal and Torres Strait Islander people.
- Ask: What affects turtle population numbers?
- Ask students to hand draw a picture of a turtle thinking about its features and how these features help it survive.
Compare their drawings to an image of a turtle or this flatback turtle in 3D.
Step 3: Marine scientists
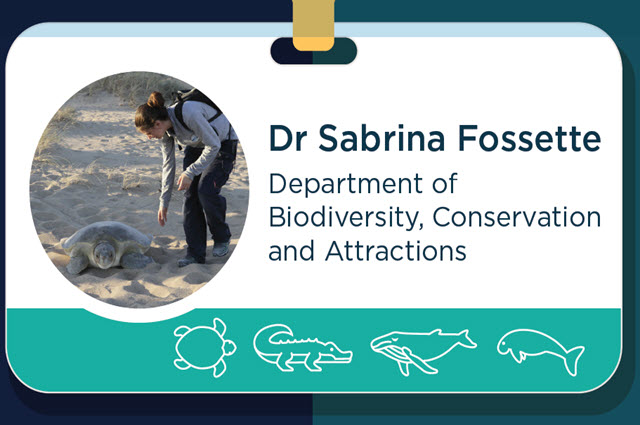
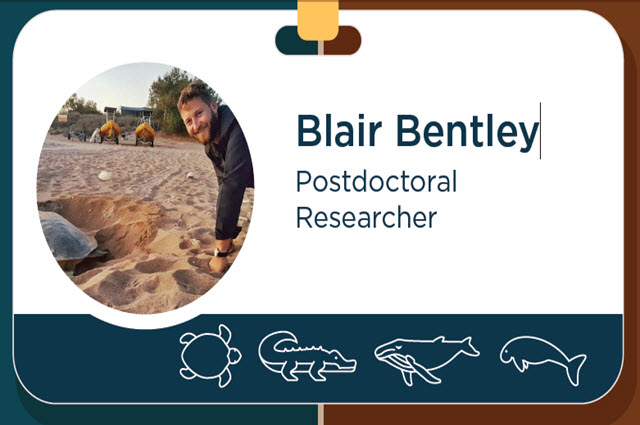
Discuss the work of scientists who work in conservation, surveying populations to ensure relevant data is collected, analysed and used to inform management strategies. Refer to career profiles for Sabrina Fossette of the Western Australian Department of Biodiversity, Conservation and Attractions and Blair Bentley, a postdoctoral researcher.
Girls in Focus:
Research has shown that when girls are exposed to positive STEM role models, their interest increases, along with an improved self-concept related to STEM fields. When showing scientists in action and use of technology, provide a balanced representation of males and females.
Step 4: Student task
Use the slide deck, Marine turtle: nesting. The slide deck introduces the question: How many eggs might a female turtle lay in her lifetime? It provides a guide to scaffold students’ mathematic, scientific and technological thinking. To answer the question students need to know the total number of eggs a turtle lays in a season and how many seasons it nests and lays. Provide time for students to work out their own method of calculation.
Step 5: Using data in their calculation
Provide students data when they attempt to calculate the number of eggs a female turtle lays in her lifetime.
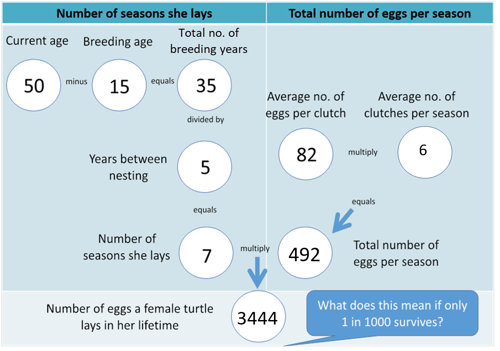
Use the following data for a leatherback turtle to complete the calculation.
- Species: Leatherback
- Current age: 50
- Breeding age 15
- Years between nesting: 5
- Average number of eggs per clutch: 82
- Average number of clutches per season 6.
Step 6: Breaking down the calculation visually
Once the students have has a go at their calculation, use the flow chart to assist students to work out the calculation. Compare this with students’ initial thoughts on the calculation.
The flow chart provides an opportunity to discuss this as a form of algorithm.
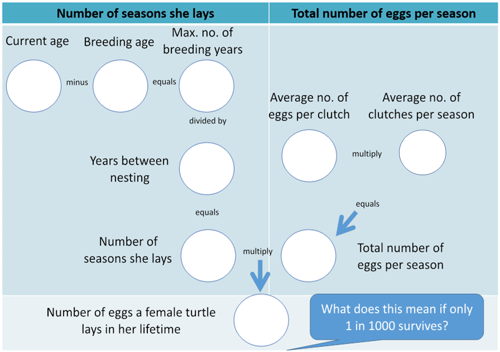
Discuss the differences regarding the total number of eggs laid in a lifetime if certain factors were changed; for example:
- if years between nesting were shorter or longer
- if the average eggs per clutch were lower or higher
- if the average number of clutches per season were lower or higher.
Talk about the likelihood that only one in 1000 turtles survive. How many of a female turtle’s offspring would be likely to survive, based on those odds? (3423/1000 = 3.423 or 3 offspring).
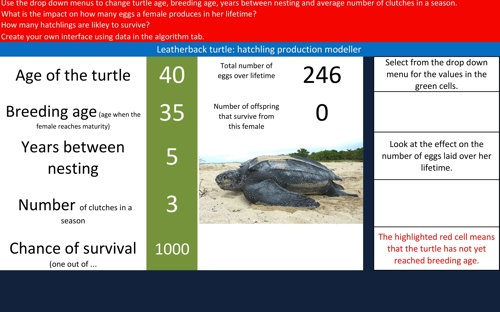
Step 7: Data modelling
Use the Turtle hatchling production modeller to calculate how many eggs a female turtle lays in her lifetime. Discuss the use of the spreadsheet to model an event like turtle hatchling survival. Discuss the green cells with inputs using drop down menus. Analyse the changes to the output cells. The spreadsheet allows students to enter different inputs to look for patterns in the data and predict outcomes based on changing parameters such as age of the turtle, breeding age, years between nesting, number of clutches per season and adjust the chance of survival of a hatchling.
Girls in Focus:
Girls often have a poor self-concept as mathematicians, believing commonly-held stereotypes that boys are naturally better than girls at maths. If you observe a number of girls showing reluctance or a lack of confidence with using spreadsheets, consider offering an additional session to practise and improve their skills. Support a growth mindset by praising their effort, strategies and behaviours.
Step 8
The Turtle hatchling production modeller allows for differentiation.
Students use the interface to explore changing the inputs and record their generalisations, for example The older the turtle the more eggs it lays in its lifetime. These generalisations can be incorporated into a brief scientific report, which could include screen captures of the modeller.
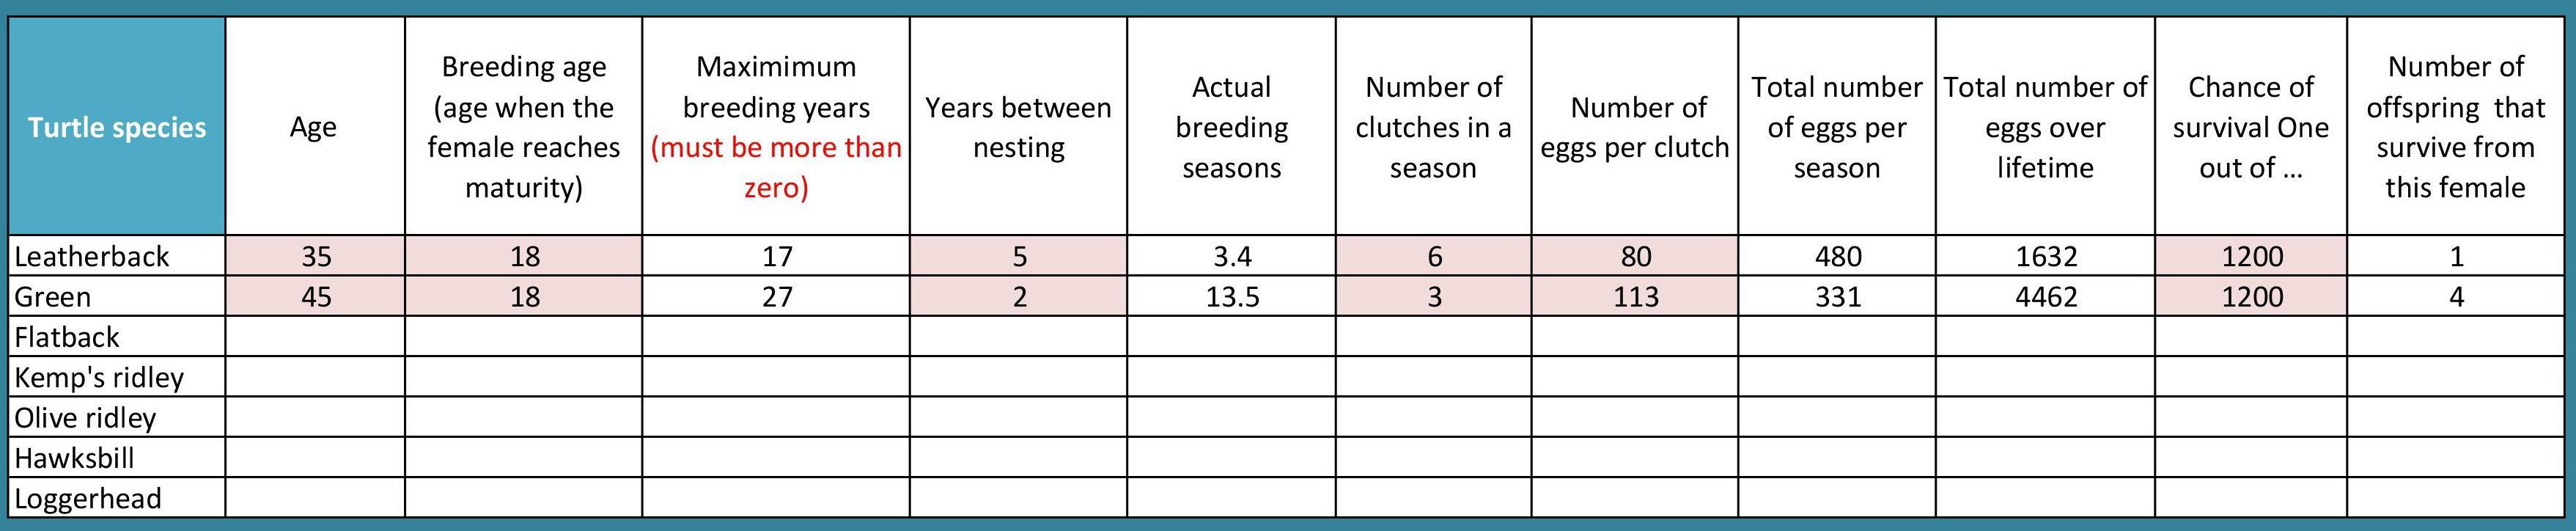
Students familiar with spreadsheeting software, such as MS Excel, Numbers for iOS or the browser-based Google Sheets, can create their own modeller. Students can use the algorithm to explore how the cells are linked. Copy a row of data and paste for a different species. Adjust the formula in the cells and data in cells for the particular turtle species, referring to the table below the algorithm, scientific data. Students can create lists for the drop down menu using the table in the workbook tab. Students will use data validation for the input cells. Conditional formatting has also been sued to Fill the output cells in red if the breeding age is a negative number. Test the model and adjust as required.
(Click on the image to expand it in a new window.)
Create their own interface for their chosen turtle species. Students consider what cells have input, which cells are hidden and how the output is displayed. They consider the use of images, font size and how data is displayed.
Step 9
Share students’ modelling of the data and what they learned. Ask them to consider global issues such as:
- plastics pollution in the ocean
- climate change and impact of rising temperature on turtle nesting.
Girls in Focus:
Research has shown that girls are interested in careers that have a positive social impact. This topic shines a spotlight on a contemporary issue that requires a balance of social, ethical, economic, conservation and cultural perspectives.
Step 10: Creating an infographic
Ask students to do some further research and create an infographic about turtle conservation incorporating the data they used in their data modelling.
Girls in Focus:
Research suggests that girls are motivated when they are given opportunities to approach projects their own way, exercising their personal preferences and creativity. Engaging with creative problem solving also encourages students to embrace failure as part of the learning process, building resilience.
Discussion
Digital Technology focus
- How can spreadsheets be used to model population data?
- What is the benefit of using a spreadsheet to model the data?
- How can you design the spreadsheet to be user friendly?
Science focus
- What factors affect the turtle population?
- The likelihood is that only one out of a thousand hatchlings will survive. How does that affect the population numbers of marine turtles? What might happen if that chance of survival decreased?
Mathematics focus
- How do you calculate the number of eggs a turtle lays in her lifetime?
- What operations do you include in the process?
Why is this relevant?
In Digital Technologies, students need to interpret data. To do this it helps to organise the data in some way; for example, in a table under relevant headings. In a spreadsheet, students can sort and filter data to look for patterns or trends.
Students present data to reveal information and convey meaning. Students can do this by developing visualisations such as graphs, tables and plots to reveal trends. In years 7–8, students model objects and events. This task allows students to model population data and infer relationships and effects of changing inputs.