About this lesson
Collect data on the biodiversity in garden beds around your school to measure the biodiversity (that is the different types of plants and animals). Explore ways to represent and present data. This lesson was devised by Linda McIver, Australian Data Science Education Institute.
Year band: Foundation, 1-2, 3-4
Curriculum Links AssessmentSuggested steps
- Use a suitable learning hook to engage students in the task of gathering data about schoolyard biodiversity. Ideas may include:
- Predict what animals might be seen in the schoolyard.
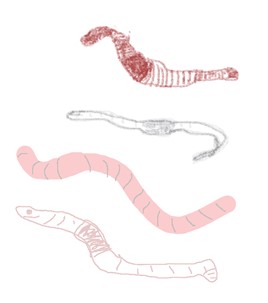
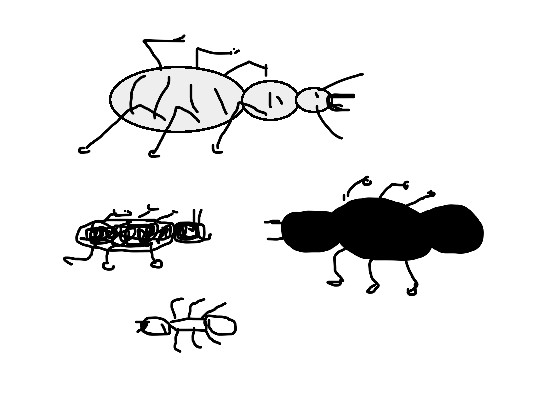
- Show images of a local bird, butterfly, bee or ‘minibeasts’ such as worms, beetles and bugs. Where might you see these animals in the school?
- What ‘minibeast’ can you find and where will you look?
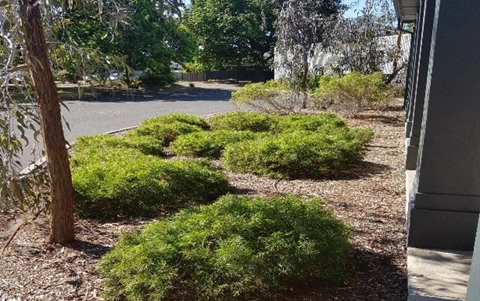
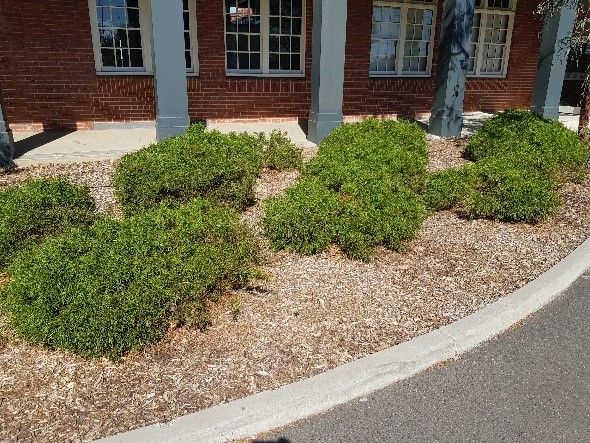
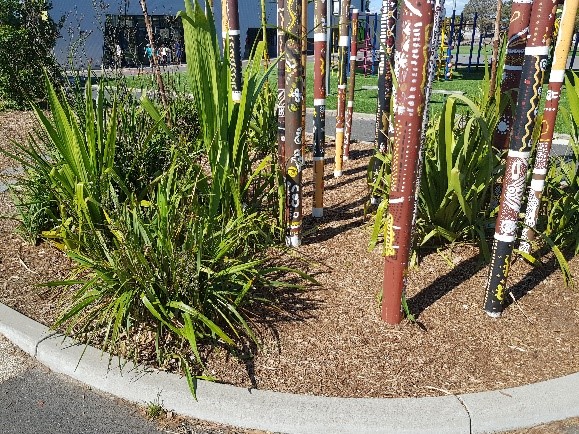
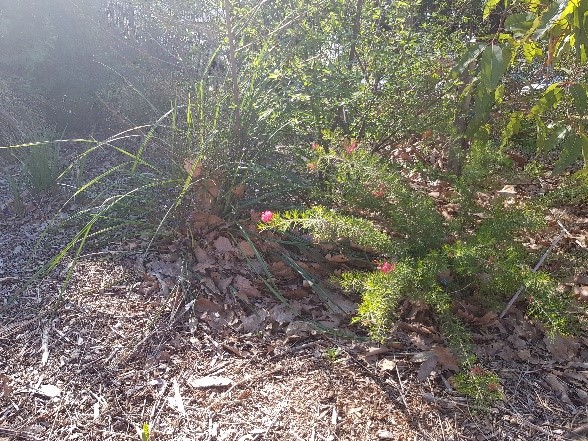
- Organise a walk around the school to take photographs of garden beds and locations where animals might be seen. (You may wish to allocate students in small groups to study and collect data on a particular area). Students could take pictures of the different plants, animals, and/or insects they see. Alternatively, students could also students construct a map with grid references and sketch what they see.
![]()
Additional scaffolding:
Some students may need individual support during this activity depending on their sensory needs (sunlight), anxiety (noises), and allergies.
-
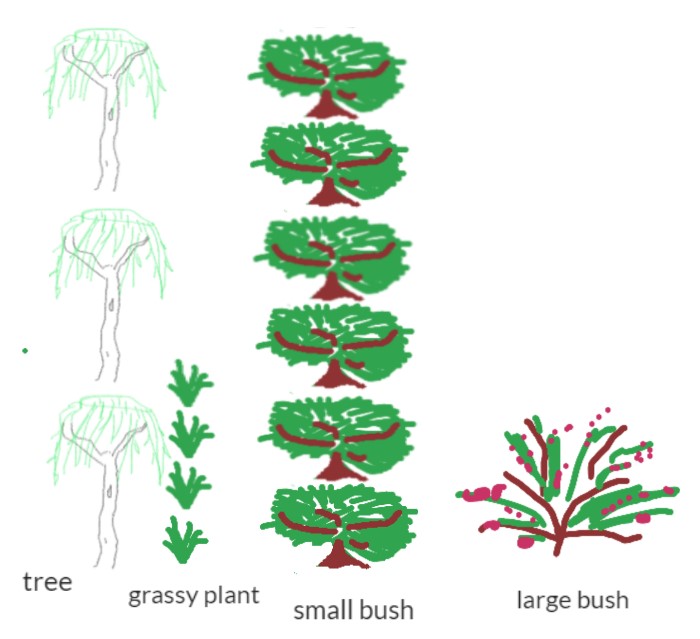
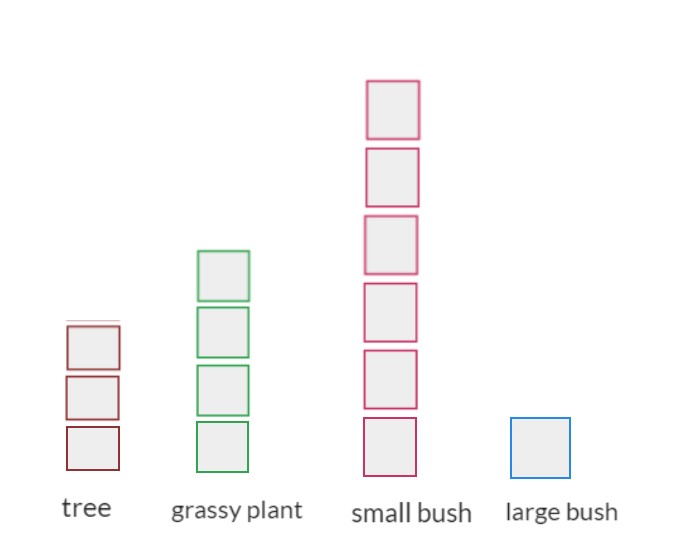
Have students count the plants and describe them, for example 6 small bushes, 4 grassy plants, 3 trees and a large bush. Discuss ways to represent each plant. Students may draw a representation of each plant or use a coloured shape to represent different plants. As students present the information, discuss the need for title and other text that may help others ‘read’ or interpret the information.
![]()
Working memory:
To simplify the task, students could just take photos outside using a camera or tablet and then back in the classroom, use those photos to do variations of the above tasks such as tallying the number of different plants they saw or the number of different colours in a photograph.
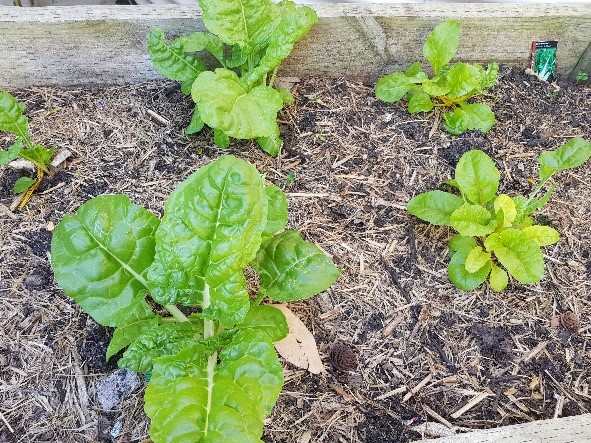
- Discuss other data that can be collected about the garden bed. Data can be recorded using images or text. An example may include data such as:
Position Ground covering Soil: What it looks like Soil: How it feels Non-living Mostly in sun Bark chips Grey and sandy Dry and dusty Rocks and log - Discuss ways to safely and responsibly gather data about the animals that may be found in their garden bed. Observe plant leaves and flowers for winged animals such as birds, butterflies, bees, beetles and moths. Provide an icy pole stick or similar to use to move leaf litter around or a small garden spade to dig into the soil. Students may find worms, spiders, beetles, slaters and other bugs. It may be possible to capture a digital image of the animal.
- Discuss the use of a table to record the data.
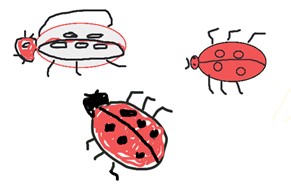
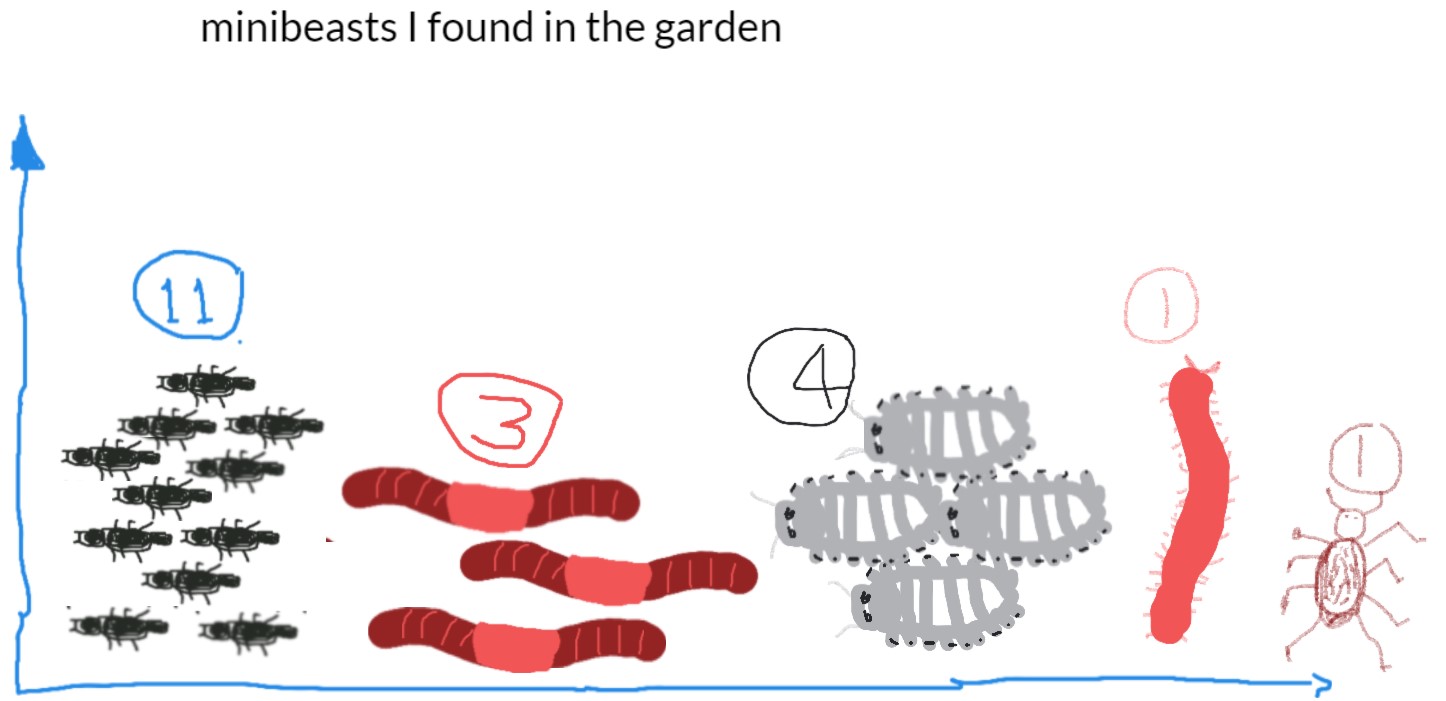
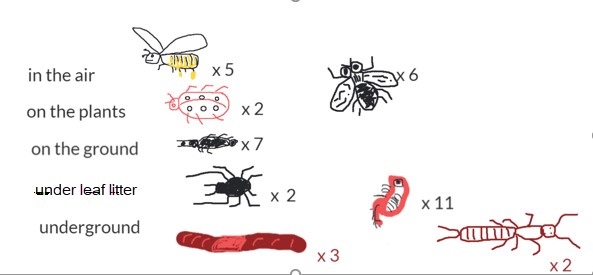
Mini-Beast Number Location Bee 5 On plant flowers Slaters 6 Under leaf litter Brown spiders 3 Under leaf litter Ants Lots (more than 50) Everywhere Worms 13 All in soil - Discuss ways to represent the animals observed. Before the task, ask students to show how they would digitally represent a lady bug, worm and ant. You may use software such as Paint or an app such as Explain everything. Share some examples using an interactive whiteboard or similar approach to enable class discussion. Discuss the use of colour and identifying features that would help make their representation immediately recognisable.
- Present the data using picture graphs or column graphs. Discuss different ways to present the information. Present and compare the group data to the class. Which garden beds have the most biodiversity?
Student sample 1, using Explain everything
Student sample 2, using Explain everything
Discussion
Science focus
- What does the data collected tell you about your garden bed?
- What season or time of the year did you observe the garden bed? Do you expect different data if you observed at another time of the year?
- Why might more animals be found in one garden bed than another? Use the shared class data to help you answer this.
- How can we improve a garden bed that didn’t have many animals? How might you investigate this and gather data?
Digital Technology focus
- What are some ways to represent data?
- What are useful ways to present data?
Why is this relevant?
In Digital Technologies, representing data refers to the way data is symbolised, visually treated or provided in audio. For example, at this level data about animals may be represented as images of each animal, emotions may be represented as emojis, and weather data may be represented as icons for wind, rain or describing the amount of sunshine. Presentation of data deals with the format it may be presented in, such as in a table, T-chart or Y-chart, a picture graph or a bar graph.
We may collect data through observations, by survey or from other sources. Data often comes to us unorganised, so the first step is to sort the data by common characteristics or attributes; then arrange the data to help make sense and look for patterns; and finally present the data visually.
For students at Years 3-4 the focus is on how the same data can be represented in different ways. An example of this is data in a table as text can be presented as images.