Acquire and interpret data
This resource helps Digital Technologies teachers understand how privacy and security can be taught from Foundation to Year 10.
What you'll find
- Key data skills: acquire, validate, visualise and interpret
- Clear descriptions of how data skills develop from Foundation to Year 10
- Practical classroom examples
- Resources to support planning and assessment
Acquiring and interpreting data focus by year band:
| Year band | Students learn to |
|---|---|
| Foundation | Collect, sort and compare data from familiar situations. (Mathematics) |
| 1 - 2 | Use digital tools to collect data, and make lists, tables, pictographs and charts, comparing and describing features. (Mathematics) |
| 3 - 4 | Acquire data from datasets as well as collection, record in tables and spreadsheets, make and compare visualisations, and interpret them with context. (Mathematics) |
| 5 - 6 | Validate acquired data, make visualisations, interpret and discuss line graphs and data distributions. (Mathematics) |
| 7 - 8 | Use both spreadsheets and databases to acquire, store and validate data, analyse to identify trends, draw conclusions and make predictions, and begin to work with data that is structured with attributes. (Digital Technologies) |
| 9 - 10 | Develop ways of acquiring, storing and validating data while considering privacy and security, make interactive visualisations, analyse to identify outliers, and structure and access data in the form of entities with relationships. (Digital Technologies) |
What are these data skills?
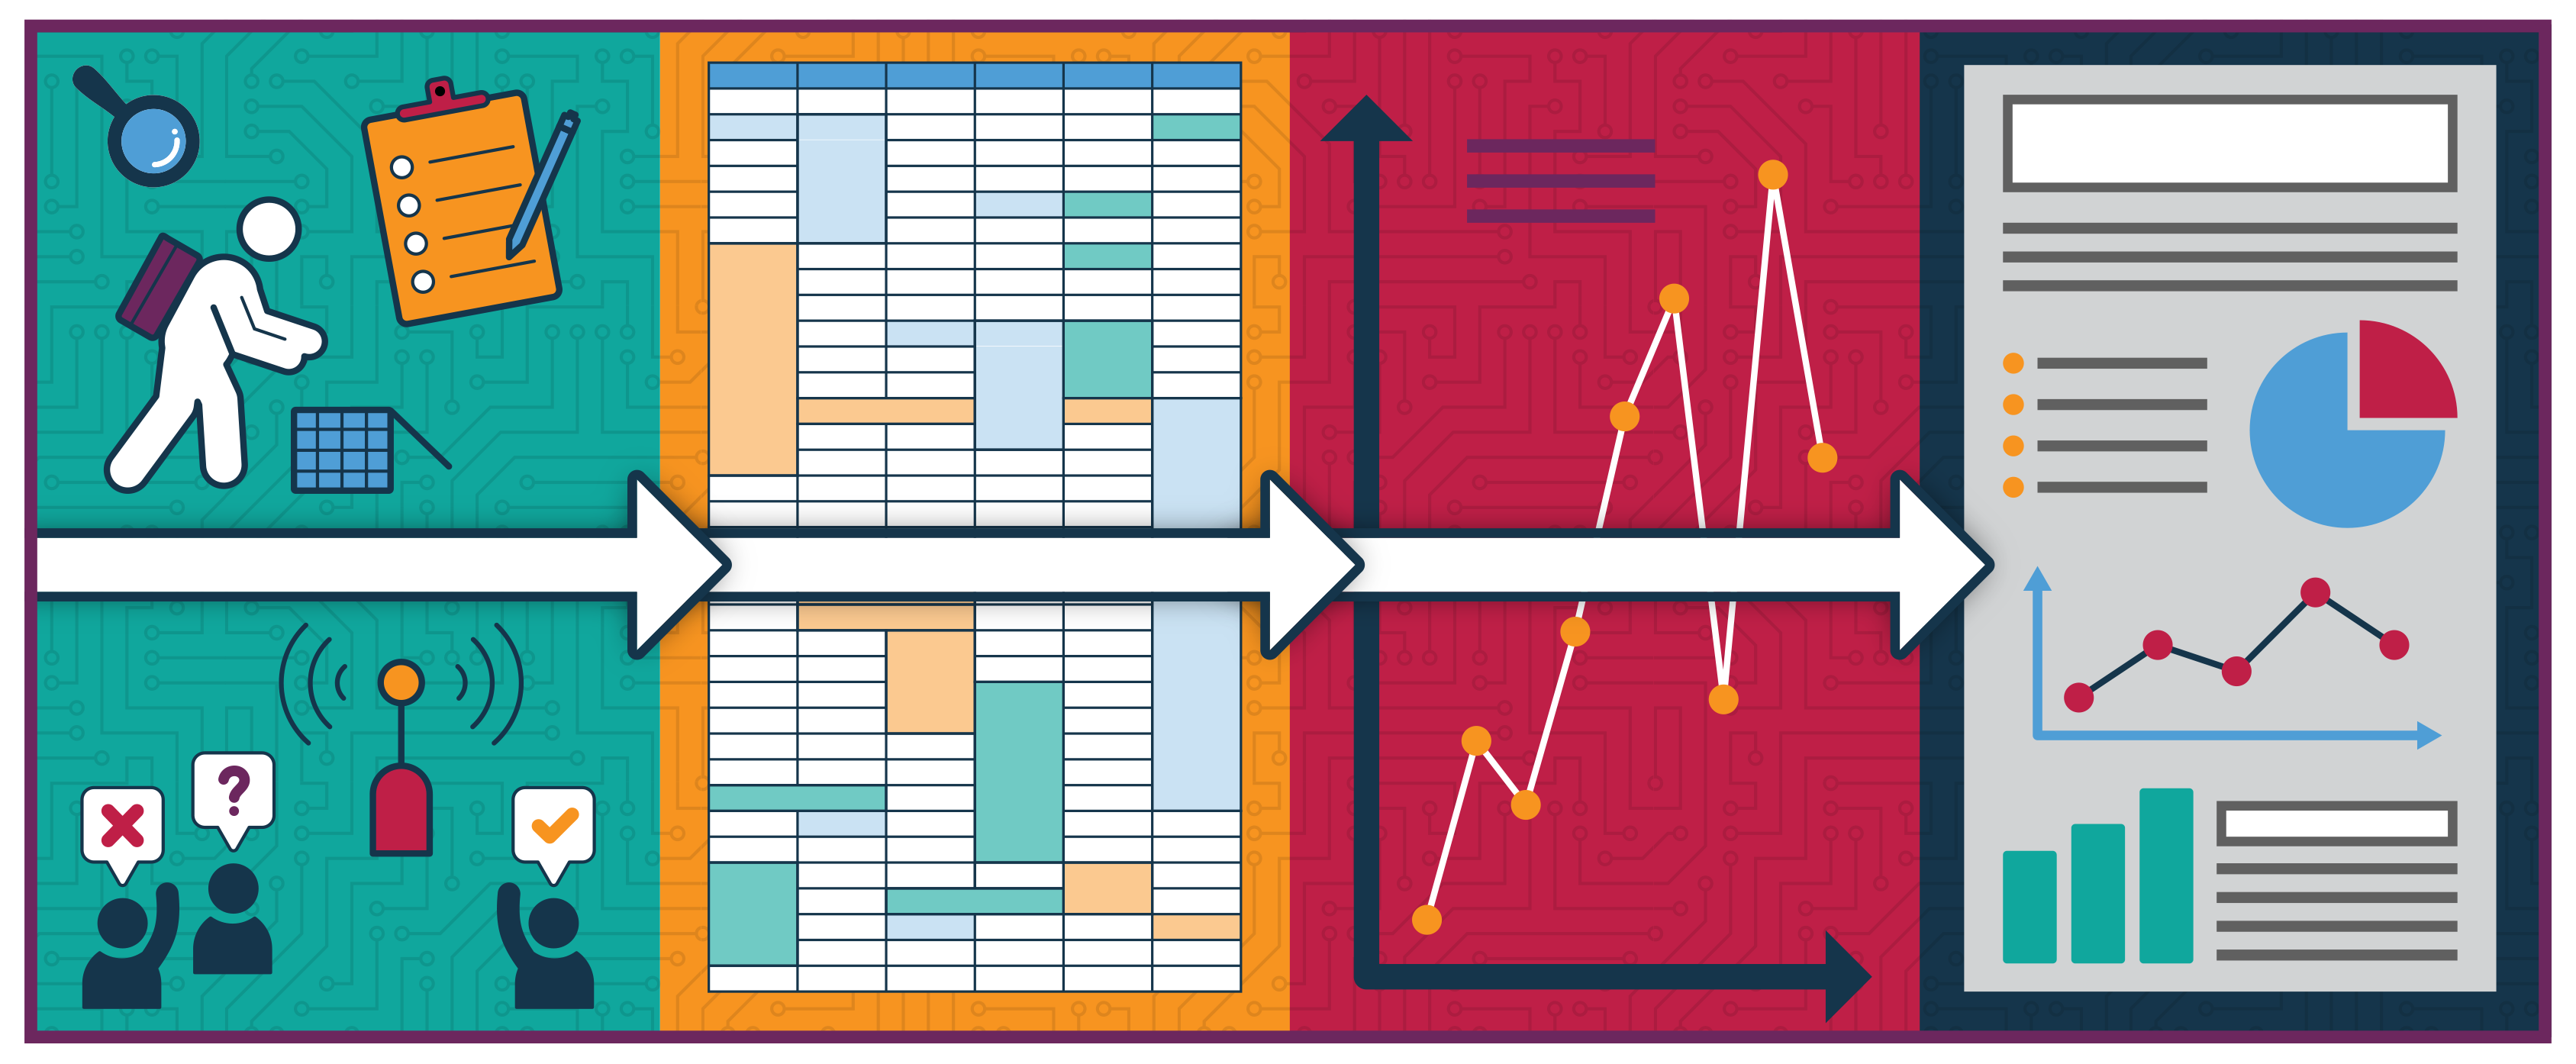
Acquiring, storing, validating, analysing and visualising data are key practices in data investigations. Students collect, prepare and manage data from a range of sources, then analyse and visualise the data to identify patterns, gain insights and draw conclusions.
A simpler explanation can help …
Suppose we want to answer the question ‘How many hours per week do students in my year spend on screens?’
Acquire: we need to gather data. We can collect it ourselves through surveys, observations or experiments, or obtain it from an existing dataset.
Store: we need to organise and securely store the data so it can be accessed and used effectively. This may involve cleaning the data, correcting errors, removing duplicate records and ensuring anonymity requirements are met.
Validate: we need to check that the data is accurate, complete and consistent. Validation rules can be applied during collection, and further checks can be made after the data is stored.
Analyse: we examine the data to identify patterns, trends and relationships, and use these insights to answer questions and draw conclusions.
Visualise: we represent the data using graphs, charts and other visualisations to help us understand and communicate our findings.
Why is it relevant?
Digital technologies allow students to acquire, manage, analyse and visualise data more effectively. These skills support informed decision-making and can be widely used in everyday situations, for example, in budgeting or planning a trip.
Connections to Mathematics
From Foundation to Year 6, the skills required to acquire, analyse and visualise data are addressed through the Mathematics curriculum. See ‘What to teach’ for relevant links.
From Year 7 onwards, the Digital Technologies curriculum includes content descriptions that focus on software skills and the storage, validation and structure of data. In contrast, the Mathematics curriculum focuses on the reasonable and critical interpretation of data, as well as specific numerical techniques for analysis.
For relevant topics with a Mathematical focus, refer to Year 7 Acquire and record data (opens external website in a new window) , Year 8 Collect sort and compare data (opens external website in a new window) , Year 9 Collect sort and compare data (opens external website in a new window) and Year 10 Interpret and discuss data displays. (opens external website in a new window)
Connections to Digital Literacy
The Digital Literacy general capability includes Investigating, an element that complements the skills in this topic and supports the application of a data-investigation process across learning areas.
Students acquire and collate data by collecting and assessing information, and use digital tools to interpret, analyse and visualise data.
Refer to Digital Literacy: Investigating.(opens external website in a new window)
Key terms in the curriculum
These key terms appear across the curriculum and are revisited at increasing levels of complexity.
| Data | A set of observations or measurements collected during an investigation |
|---|---|
| Primary data | Data collected by the user, such as through a survey, experiment or observation |
| Secondary data | Data collected by others, often obtained from a dataset or online data repository |
| Structured data | Data that is organised on a basis of a predefined model or schema and formatted in a way that shows relationships, such as fields, rows and columns. This structuring makes the data more easily searchable. |
| Validation | Checking or filtering data for errors and unacceptable or unexpected values |
| Visualisation | A visual representation of data, such as a pictograph, chart or line graph |
| Interactive visualisation | A visualisation that presents data differently in response to selections by a user |
| Spreadsheet | A table of rows and columns used to organise data, perform calculations and make visualisations |
| Database | A collection of data structured into entities that allows for effective and efficient storage and management |
| Data | Data can take a wide range of forms, depending on its source. Examples:
|
|---|---|
| Structured data | The best way to structure data depends on its quantity as well as its purpose. Examples for storing song data:
|
| Validation | Saving files in a protected school account rather than on a shared device where others could access them |
| Spreadsheet | Spreadsheet software is readily available on most devices. Fundamental features, such as charts and formulas, are common across these.
|
| Database | Offline or file-based databases: data is stored and managed on an individual computer, much like a document. These systems often include a graphical user interface that can be used to create tables, forms, queries and entity relationship diagrams.
Client-server databases: data is stored on a central server and accessed by one or more computers, with or without a graphical user interface. This approach supports multiple users and larger datasets.
|
What to teach?
The skills of collecting and studying data are introduced early, from Foundation, and build in complexity right through to Year 10.
Here’s how the concept develops across year bands:
Acquiring and interpreting data in Foundation
The focus is on collecting, sorting and comparing data while investigating questions related to familiar situations.
NOTE: These skills are taught in the Mathematics learning area in Foundation.
| Mathematics learning area |
|---|
Relevant ACARA content descriptions – Foundation
Examples in practice Refer to the Planning tool topic: Collect, sort and compare data (opens external website in a new window)
|
Acquiring and interpreting data in Years 1–2
The focus expands to include a wider range of methods for collecting and recording data, such as lists, tally marks, surveys and experiments. Students represent data using pictographs and column charts, including through the appropriate use of digital tools. They compare and discuss data by examining frequencies and identifying features within the representations to answer questions and communicate findings.
NOTE: These skills are taught in the Mathematics learning area in Years 1 and 2.
| Mathematics learning area |
|---|
Relevant ACARA content descriptions – Year 1
Examples in practice Refer to the Planning tool topic: Acquire, record and represent data (opens external website in a new window)
|
Relevant ACARA content descriptions – Year 2
Examples in practice Refer to the Planning tool topic: Acquire, record and represent data (opens external website in a new window)
|
Acquiring and interpreting data in Years 3–4
The focus includes collecting, representing and interpreting categorical and discrete numerical data. Students create, compare and evaluate data displays, interpret data in context, and conduct statistical investigations to answer questions and communicate findings.
NOTE: These skills are taught in the Mathematics learning area in Year 3 and Year 4.
| Mathematics learning area |
|---|
Relevant ACARA content descriptions – Year 3
Examples in practice Refer to the Planning tool topic: Interpret and compare data displays (opens external website in a new window)
Refer to the Planning tool topic: Conduct statistical investigations (opens external website in a new window)
|
Relevant ACARA content descriptions – Year 4
Examples in practice Refer to the Planning tool topic: Interpret and compare data displays (opens external website in a new window)
Refer to the Planning tool topic: Conduct statistical investigations (opens external website in a new window)
|
Acquiring and interpreting data in Years 5–6
The focus extends to include acquiring, validating and representing data using digital tools, interpreting a wider range of visualisations such as line graphs, and analysing data distributions in context. Students increasingly plan and conduct their own statistical investigations by posing questions or identifying problems, selecting appropriate representations and communicating findings.
NOTE: These skills are taught in the Mathematics learning area in Year 5 and Year 6.
| Mathematics learning area |
|---|
Relevant ACARA content descriptions – Year 5
Examples in practice Refer to the Planning tool topic: Interpret and compare data displays (opens external website in a new window)
Refer to the Planning tool topic: Conduct statistical investigations (opens external website in a new window)
|
Relevant ACARA content descriptions – Year 6
Examples in practice Refer to the Planning tool topic: Interpret and compare data displays
Refer to the Planning tool topic: Statistics in the media • Explore the way graphs are used to display information. Refer to the Planning tool topic: Conduct statistical investigations
|
Acquiring and interpreting data in Years 7-8
Expectation for this band
Students can:
- collect data from surveys, observations, experiments, sensors and existing data repositories, using spreadsheet or database software as appropriate
- check data for errors and other anomalies manually, and/or using software features
- describe data structured in terms of entities with attributes
- perform queries to filter, sort and extract data from a single-table database
- use spreadsheet software to summarise and visualise data
- identify trends, draw conclusions and make predictions from the data.
The focus includes using spreadsheet and database software to collect, store, validate and access data. Students analyse data to identify trends and patterns, draw conclusions and make informed predictions.
What this looks like in practice
Isolated activities help students learn and practise individual data skills, while data investigations allow students to apply these skills in a purposeful sequence.
For example, students can:
- collect data about home screen time using an electronic survey
- collect data about school hallway noise levels using sensors from an electronic device or classroom robot
- use an online data repository to access a raw census spreadsheet, then ‘clean’ the data to remove irrelevant detail and deal with missing entries or errors
- discuss the structure of a table of data, identifying the object or event, and its attributes
- perform simple structured query language (SQL) queries on an existing database to extract a table of data that can be further analysed in a spreadsheet
- use formulas, filters and other spreadsheet features to summarise data into totals, averages or frequencies
- generate charts or graphs that help identify trends and patterns from the data, then draw conclusions.
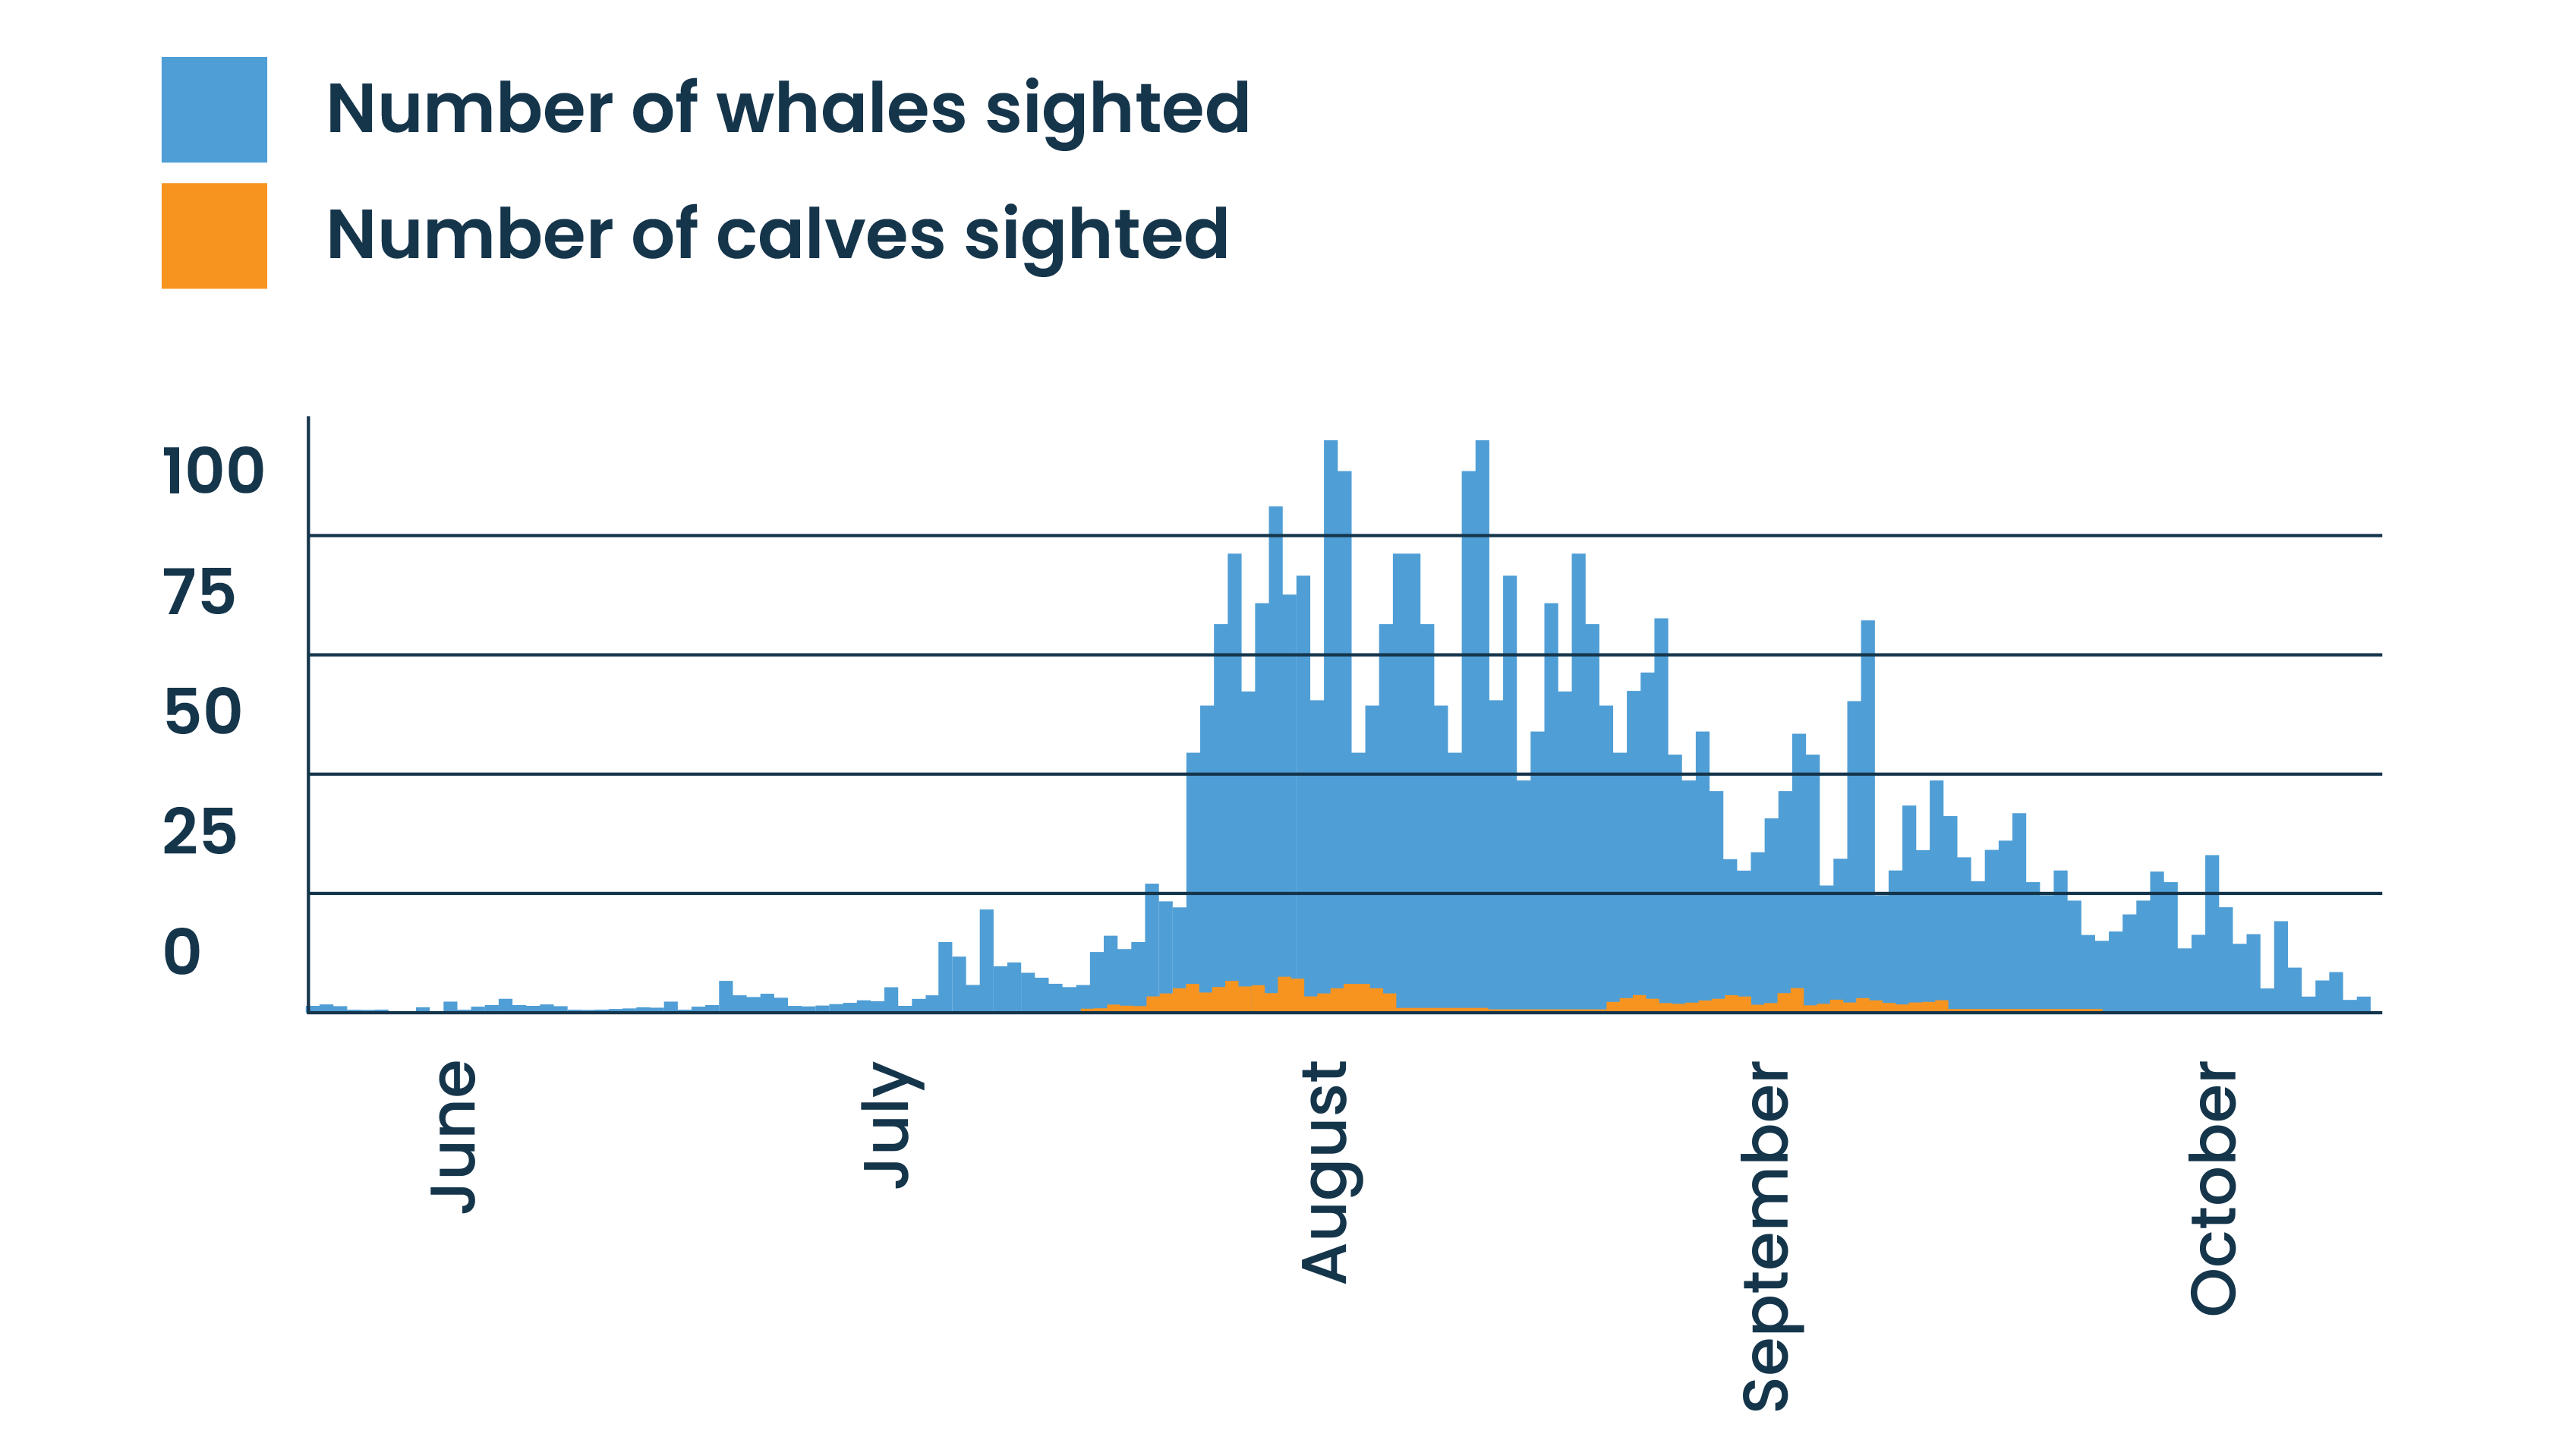
By the end of this lesson, students will be able to perform basic data cleaning on a dataset obtained from an existing source. They will identify and address common issues before summarising and visualising data.
Teacher preparation: Find an existing large dataset and ‘mess it up’ a little to introduce errors and other anomalies common in real-world datasets.
You could use an existing dataset that is part of a classroom data investigation, such as the lesson Humpback whales: what the data reveals. (The dataset can be accessed from the Resources section of that lesson.)
- Find a column critical to the investigation, such as ‘Total whales sighted’.
- Deliberately modify a few values in this column; for example, make some values negative, clear some cells or replace numbers with words.
Retrieval: Ask students to recall different ways they can acquire data and use a spreadsheet to investigate that data. Students may suggest:
- collecting it themselves through experiments, sensors or surveys
- generating sample data using a digital tool
- accessing existing data from spreadsheets, online repositories or databases.
Elaborate on the following approaches for acquiring data.
- Access a spreadsheet .xlsx file provided by the teacher or in a lesson.
- Access an online data repository, such as the Australian Census, the Bureau of Meteorology or Kaggle, and download the data as a .csv file.
- Access a database and perform a query to get a table of data to export into a spreadsheet.
Step 1: Provide students with the modified dataset.
Students may be overwhelmed when they first open the dataset in their spreadsheet software. The lesson Humpback whales: what the data reveals provides advice on guiding students when they approach a large dataset.
Discuss as a class: what makes this dataset difficult to understand at first glance?
Step 2: Discuss the context of the dataset and give the students time to examine it.
After making a copy of the sheet, guide students through basic data-cleaning steps to make the dataset easier to navigate and analyse.
- Bold the column headings.
- Freeze the top row.
- Hide or delete columns that are not needed at all (after making careful decisions).
- Rename the remaining column headings to be clearer about what they contain.
Step 3: Ask students to examine the modified ‘Total whales sighted’ column and identify any anomalies.
Discuss what to do about the anomalies spotted.
- How do we decide if they really are errors?
- How will they affect our analysis and visualisations?
- Do we delete those rows?
- This is a very large amount of data. Manual validation (looking through the data ourselves) may not detect all the negative values, for example. If using Microsoft Excel, you can use the ‘Data Validation’ feature (on the Data tab) to circle invalid values.
Step 4: Demonstrate to the class how to access a different dataset from an actual online repository where the data can be downloaded in .csv format, for example:
- visit the Bureau of Meteorology’s Climate Data Online (opens external website in a new window) to get a table of Daily Rainfall for your school’s suburb (it downloads as a .zip file with .csv file inside)
- visit the Australian Bureau of Statistics to find Census data (opens external website in a new window) on a topic.
Prompt students to download and open the dataset themselves, then perform some basic cleaning as appropriate.
Evidence of learning
You might notice that students:
- become more comfortable with navigating a large dataset
- determine what the different columns in the dataset actually represent
- format and rename columns for better understanding and navigation
- identify and deal appropriately with anomalies
- download and explore a dataset from an online data repository.
Common misconceptions or errors to watch for
- Making charts or performing other analyses before the data has been cleaned
- Deleting columns from the dataset without adequate justification
- Assuming rows with missing entries can always be deleted.
Poster: Key ideas, practical examples, Australian Curriculum
Download the Acquiring, analysing and visualising data poster (7-9) (PDF) (opens in a new window)
To check for connections to the Mathematics curriculum, refer to:
Acquiring and interpreting data in Years 9-10
Expectation for this band
Students can:
- collect data from surveys, observations, experiments, sensors and existing data repositories, using spreadsheet or database software as appropriate
- demonstrate how privacy of users can be upheld in the way their data is collected and stored
- apply simple security measures to protect data, where appropriate
- validate data during and/or after collection
- describe data structured in terms of relationships between entities with attributes
- perform queries to filter, sort and extract data from a relational database
- use spreadsheet software to summarise data
- create interactive visualisations
- identify trends and outliers, draw conclusions and make predictions from the data.
The focus centres on developing ways of working with spreadsheets and databases to collect, store and validate data efficiently, while securing data to uphold users’ privacy. Additionally, visualisations become interactive, and structured data now includes relationships between entities.
What this looks like in practice
Isolated activities enable students to learn and practise skills, while full data investigations can place them into a meaningful sequence.
For example, students might:
- collect data about students’ use of school facilities via an electronic survey, designing questions to accept only valid values and to avoid collecting unnecessary personal information
- collect data about the pH level in a fish tank via a robot designed to measure it regularly
- use an online data repository to access data that complements data already collected
- ‘clean’ spreadsheeted data to remove irrelevant detail and deal with anomalies
- depersonalise spreadsheeted data by removing personal information
- describe ways that data can be kept secure while stored
- discuss the structure of two or more related tables of data, identifying the objects or events, their attributes, and their relationships with each other
- perform simple SQL queries on an existing database to extract a sorted table of data that can be further analysed in a spreadsheet
- use formulas, filters and other spreadsheet features to summarise data into totals, averages or frequencies
- generate charts or graphs that respond to user interaction.
When a spreadsheet won’t do
Learning intention: Students describe how data can be organised using two related tables and explain the advantages of this structure over a single spreadsheet table.
Retrieval: Think of a person, object or event.
- What information (attributes) could be stored about it?
- What information would need to be stored about related objects or events?
Examples:
- student: name, age, year level
- book: title, author, year of publication
- movie: title, release year, genre
Step 1: Store the data in a spreadsheet
We want to create a list of famous actors and the movies they have appeared in.
As a class, identify some attributes to record:
- firstName
- surname
- birthdate
- movieTitle
- movieYear
Explain that database fields are often named using ‘camelCase’, where the first word begins with a lowercase letter and each additional word begins with a capital letter (for example, firstName and movieTitle). This format is commonly used in databases and programming because field names can’t always contain spaces.
Prepare the data into a spreadsheet with two or three rows completed and model completing the remaining rows.
| firstName | surname | birthdate | movieTitle | movieYear |
|---|---|---|---|---|
| Tom | Hanks | 09/07/1956 | Forrest Gump | 1994 |
| Leonardo | DiCaprio | 11/11/1974 | Titanic | 1997 |
| Emma | Watson | 15/04/1990 | Harry Potter | 2001 |
| Dwayne | Johnson | 02/05/1972 | Jungle Cruise | 2021 |
Step 2: Identify the problem
What if we add another Tom Hanks movie?
| firstName | surname | birthdate | movieTitle | movieYear |
|---|---|---|---|---|
| Tom | Hanks | 09/07/1956 | Forrest Gump | 1994 |
| Tom | Hanks | 09/07/1956 | Cast Away | 2000 |
| Leonardo | DiCaprio | 11/11/1974 | Titanic | 1997 |
| Emma | Watson | 15/04/1990 | Harry Potter | 2001 |
Discuss:
- What information is being repeated?
- What would happen if we accidentally entered Tom Hanks’ details differently in one row?
- How many places would we need to update if a mistake was discovered?
State the problem and issue: Actor information is duplicated. Repeated data increases the risk of errors and makes the dataset harder to maintain.
Step 3: Create two related tables
We have identified that storing actor information multiple times can lead to errors and makes the data harder to maintain. A better solution is to separate the data into two related tables: one for ‘Actors’ and one for ‘Movies’.
Actors
| actorID | firstName | surname | birthdate |
|---|---|---|---|
| 1 | Tom | Hanks | 09/07/1956 |
| 2 | Leonardo | DiCaprio | 11/11/1974 |
| 3 | Emma | Watson | 15/04/1990 |
Movies
| movieID | movieTitle | movieYear | actorID |
|---|---|---|---|
| 101 | Forrest Gump | 1994 | 1 |
| 102 | Cast Away | 2000 | 1 |
| 103 | Titanic | 1997 | 2 |
| 104 | Harry Potter | 2001 | 3 |
Discuss:
- Which information is no longer duplicated?
- Why is actorID used instead of the actor’s name?
- How does this structure reduce errors?
Make clear that one actor can be linked to many movies. The relationship is created through the actorID.
Step 4: Summarise the benefits
Compared with a single spreadsheet table, this two-table structure:
- reduces duplication
- improves data integrity
- makes updates easier
- allows larger datasets to be managed more efficiently.
Optional extension: Real movie databases are more complex than our example.
For example, Toy Story has many actors, and all these actors can each appear in multiple movies.
Discuss the following.
- How could we represent a movie with several actors?
- Would our two-table design still work?
This leads to a many-to-many relationship, which requires an additional table to store the links between actors and movies.
Evidence of learning
You might notice that students:
- identify suitable entities and attributes for a dataset, such as Actors and Movies, or Athletes and Sports
- explain how storing the same information multiple times can create errors and make data harder to maintain
- justify the use of two related tables instead of a single table
- describe how a unique identifier can be used to create a relationship between two tables
- describe the relationship between the two entities using an example from the dataset
- create and populate a simple two-table database, or use queries to retrieve information from an existing database.
Common misconceptions or errors to watch for
- Assuming that storing the same information multiple times is not a problem and overlooking the risk of inconsistent or incorrect data
- Believing that two tables automatically improve a dataset without understanding how the relationship between them works
- Using names or other attributes to link tables instead of a unique identifier such as actorID
- Misunderstanding the relationship between the two entities, for example, assuming that the design allows a movie to have multiple actors when it only allows one actor to be linked to each movie
- Finding it difficult to create or interpret relationships between tables when using database software.
Poster: Key ideas, practical examples, Australian Curriculum
Download the Acquiring, analysing and visualising data poster (9-10) (PDF) (opens in a new window)
To check for connections to the Mathematics curriculum, refer to:
Plan your teaching
Explore sample units and lessons.
These sample units show how data representation can be taught as a short sequence or extended unit at each year level.
Foundation (Mathematics): Paying It Forward (Years F–2) (opens external website in a new window)
Years 1–2 (Mathematics): Paying It Forward (Years F–2) (opens external website in a new window) , Recording data in a game of Kolap (opens external website in a new window)
Years 3–4 (Mathematics): Paying It Forward (Years 3–4) (opens external website in a new window)
Years 5–6 (Mathematics): Paying It Forward (Years 5–6) (opens external website in a new window) , Osprey data investigations (opens external website in a new window)
Years 7–8 (Digital Technologies): Working with data, Collaborative data project
Years 9–10 (Digital Technologies): Data science skills
Use this planning template (opens docx in a new window) to record relevant information as you view a scope and sequence topic for your year level.
Research-informed teaching
Evidence-based approaches
- Semantic waves (concrete to abstract learning)
- Dual coding (visual and verbal)
- Worked examples with gradually reduced scaffolding
Semantic waves
Research from the National Centre for Computing Education shows that students understand abstract ideas more deeply when teachers deliberately move between everyday examples and formal terminology.
What this looks like in practice
- Use datasets that are familiar and meaningful to students when introducing spreadsheet and database concepts.
- Begin with concrete examples before introducing formal terms such as rows, columns, tables, entities and attributes.
- Encourage students to move between examples and abstract representations to build conceptual understanding.
Example
Students are introduced to database structures using familiar data that demonstrates the need for multiple entities and attributes, such as Pokémon and their elemental types, or sports teams and their players. After exploring these examples, students are introduced to formal concepts such as entities, attributes and relationships.
Less familiar examples, such as employee records or scientific datasets, may add unnecessary complexity when students are first learning how databases are structured.
Dual coding
Research synthesised by Richard E. Mayer shows that students learn new concepts more effectively when information is presented using both words and visuals, reducing cognitive load and supporting deeper understanding.
What this looks like in practice
- Present new concepts using spoken or written explanations as well as visual representations.
- Use diagrams, images, symbols or simple models alongside verbal descriptions.
- Explicitly link the visual elements to the language being used.
- Revisit the concept using both modes together to reinforce understanding.
Example
Students are introduced to an existing database that the teacher has prepared so they can practise writing SQL queries.
The teacher uses an entity relationship diagram alongside verbal explanations of tables, attributes and relationships. As students construct SQL queries, they refer to the diagram to identify which tables are related and why particular connections are needed. The visual representation helps students connect the abstract SQL syntax with the underlying structure of the database.
Worked examples and scaffolding
Research synthesised by the Australian Education Research Organisation shows that modelling worked examples and gradually reducing support improves learning of complex procedures.
What this looks like in practice
- Model a complete example before asking students to work independently.
- Make the thinking process explicit by explaining decisions and steps as they occur.
- Provide structured support (such as prompts, templates or partially completed examples).
- Gradually remove scaffolds as students gain confidence and competence.
Example
A teacher demonstrates how to access and clean a dataset obtained from an online data repository.
- Step 1 (worked example): the teacher presents a completed spreadsheet where the data has already been cleaned and summarised. They explain the steps and decisions that were made, such as removing duplicate records, correcting errors and applying consistent formatting.
- Step 2 (guided practice): the teacher models the process of locating, downloading and cleaning a dataset while students follow along using the same dataset. Prompts and instructions are provided to support students at each stage.
- Step 3 (independent practice): students independently locate a different dataset from an online repository and apply the same data-cleaning and summarising techniques with minimal support.
Check understanding
- Foundation: Rubric
- 1–2: Work sample
- 3-4: Work sample
- 5-6: Assessment advice and deliverables
- 7-8: Assessment task and rubrics
- 9-10: Course completion and assessment lessons
Teachers can assess student learning in a range of ways, including through checklists, observations, rubrics and student work samples.
- Foundation: The unit Paying It Forward (F–2) (opens external website in a new window) includes a rubric and achievement standards for each year level.
- Years 1–2: The unit Paying It Forward (F–2) (opens external website in a new window) includes a rubric and achievement standards for each year level.
- Years 3–4: The unit Paying It Forward (3–4) (opens external website in a new window) includes a rubric and achievement standards for each year level.
- Years 5–6: The lesson series on Osprey data (opens external website in a new window) includes assessment advice for each lesson and several deliverables.
- Years 7–8:
- Use the assessment task at the end of the UK lesson series Modelling data using spreadsheets (opens external website in a new window) to assess spreadsheet skills.
- Lessons in the Data Science STEM resources include rubrics to assist with assessment of a data-analysis process.
- Years 9–10:
- The unit Data (opens external website in a new window) from the US Computer Science Principles course provides an assessment lesson.
- The Beginners Databases - SQL (opens external website in a new window) course is self-marking, allowing teachers to monitor student progress, with an SQL playground (opens external website in a new window) where teachers can assign tasks for assessment.
Deepen your understanding
Explore these resources to help teach the skills and concepts for acquiring and interpreting data:
- Australian Data Science Education Institute (opens external website in a new window) – resources and blog focused on teaching data skills and concepts in primary and secondary schools.
- The Data Science–related courses at Grok Academy (opens external website in a new window) focus on curriculum-relevant concepts as well as skills, and include unplugged resources (opens external website in a new window) for lessons.
- Excel Easy (opens external website in a new window) – brush up on your spreadsheet skills.
- AI professional learning (Digital Technologies Hub) – AI is often used as part of data science.
Supporting resources
- Download posters by year band: [7-8] (opens PDF in a new window) [9-10] (opens PDF in a new window)
- Download full 7–10 pack of posters (PDF) (opens in a new window)
- DT Unit Planning Template (6–8 weeks) (MS Word) (opens in a new window)