About this lesson
Reducing carbon dioxide emissions and sustainable energy use and are two of the major issues facing the world today. This project explores energy use in homes, and compares individual energy use with the class average and calculate and graph CO2 emissions.
Year band: 5-6
Curriculum Links AssessmentLearning intentions
- Collect data about class household energy use.
- Compare individual energy use with the class average.
- Use states/territories Emissions Factor to calculate household CO2 emissions.
- Graph household energy use and emissions.
- Identify ways households can save energy and therefore emit less CO2.
Suggested steps
- Discuss with students their home energy use; in particular, the use of electricity. Ask them to brainstorm all the electrical appliances they use at home and to rate how much electricity each one uses, using a scale of low, medium and high. Do they know what unit electricity usage is measured in (kilowatts kW)? In small groups, have students choose a way to present their information; for example, a plan of their house showing the appliances in every room or a table indicating the average usage (occasional, regular, daily) of each appliance.
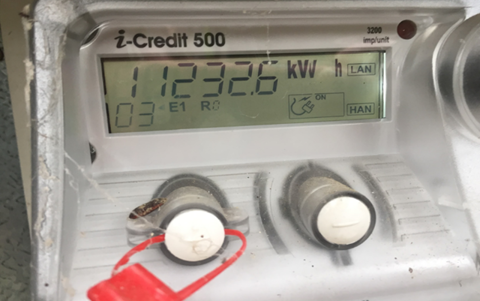
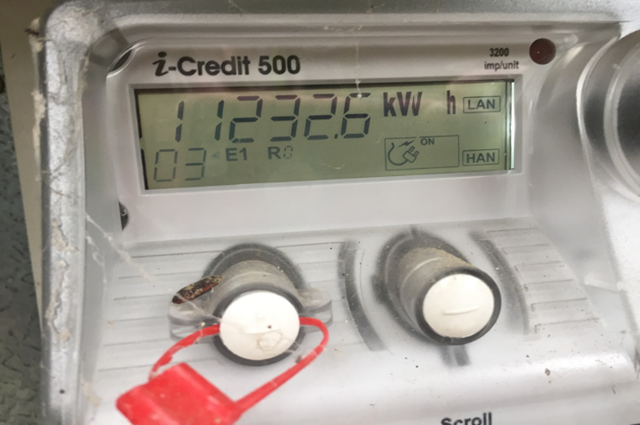
- Explain that the task is to collect home data for a week so students can compare it to the class energy use. With the assistance of their parent or carer, students record the reading on their electricity meter at the same time every day for 8 days. The reading will look something like the image below.
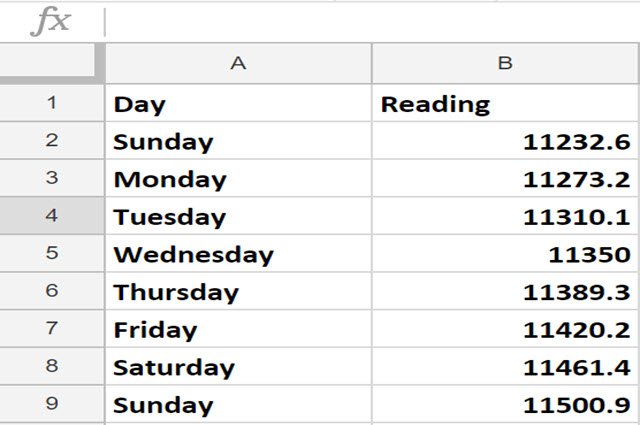
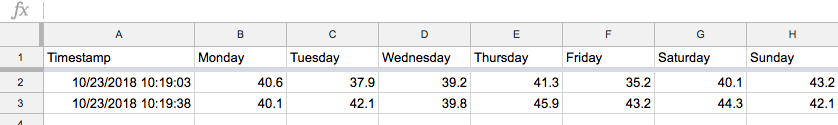
- Demonstrate to students how to enter their data in a spreadsheet; for example:
- As a class, plan what to do if someone forgets to record a day. How can this be handled while ensuring the data is still relevant? Students could:
- try to measure the electricity usage from the same day the next week, but this is likely to be different from the rest of the class data; for example, the day may be hotter or colder
- average the other days and use that value
- average the rest of the class data
- leave out that day.
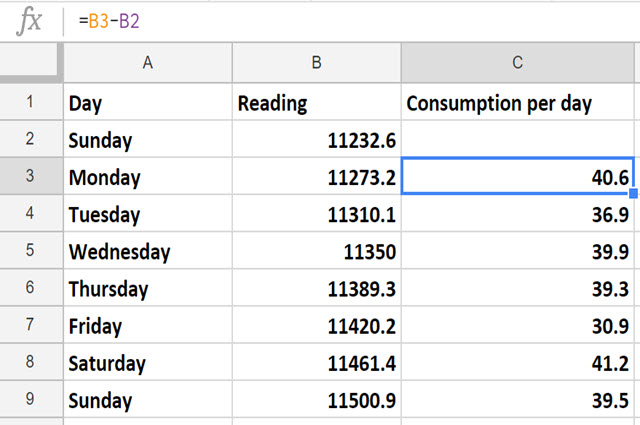
- In the spreadsheet, have students use a formula to calculate their daily usage. The simplest way to do this is to make the daily usage cell equal to the current reading cell minus the one before. So, C3 is equal to B3 – B2, et cetera (see the table below for complete data).
- Ask students to graph their daily consumption. Discuss the best graph type to use for this kind of information.
- Ask students to calculate the average daily consumption for their household, both manually and using the ‘Average’ function in the spreadsheet.
- Aggregate the class data by putting all of the information into one spreadsheet. A simple way to do this is to constructing a shared form such as a Google Form, and have each student fill it in. The results will be available for each student as unidentified data representing the 8 days. Your form might look something like the one below:
- Graph the class data, and calculate the average daily use for the class.
- Each student can compare their own household use with the class average. Questions to explore may include the following:
- Are there any patterns emerging from the data?
- How many households are above average? How many below?
- What is the highest daily use in the class? What is the lowest? How easy is it to find these values just by looking?
- Find the highest and lowest values, using the ‘Minimum’ and ‘Maximum’ functions of the spreadsheet.
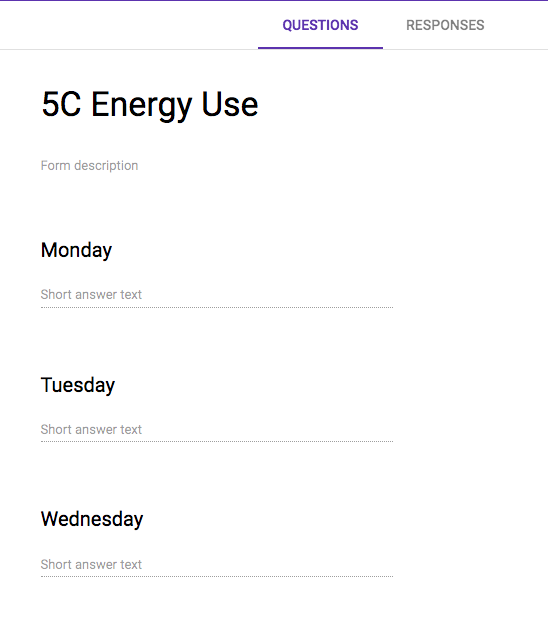 Image: Google form example
 - Calculate the total household energy used by the class in that week. Using the emissions factor for your state or territory (see Calculating greenhouse gas emissions – electrical appliances), how much greenhouse gas did your class households emit in that week?
- As a class, brainstorm ways to reduce electricity usage and hence greenhouse gas emissions.
- Ask students to make their own action list for things they think will work in their own homes to reduce emissions, and have them try that with their family for a week. Have students note the meter readings at the start and finish of that week and discuss any differences that might appear from their previously recorded data. Consider confounding factors (Was it warmer or cooler in that week than in the first week? Were there other reasons electricity usage might have changed?). How did students find the experience of persuading people to change their behaviour?
Optional challenges
- Ask students to record usage on their electricity meter for 15 minutes, with as many devices as possible switched off at the wall, and then run an appliance (such as the television) for 15 minutes and record it again. List the possible sources of energy that might have come and gone during recording time. For example, the air-conditioner might have turned on, someone might have used the kettle, power supplies on laptops or charging devices may have turned on. List some ways that you could verify the energy use of the television, given that it’s difficult, if not impossible, to turn off every other device.
- Ask students to record how many households in the class have solar panels. Ask them to calculate how much solar energy could have been produced by them over that week, given maximum output during daylight hours.
- Most household solar systems generate 1.5 kilowatts of electricity per hour.
- Assume 10 hours of maximum sunlight a day (which is unlikely as it requires perfect orientation of the solar panels, no shading, no cloud cover, etc – really advanced students could research realistic generation levels).
- If 10 hours of daylight are assumed, total electricity generation is 1.5 x 10 = 15 kilowatt hours.
- Ask students to calculate the greenhouse gas emissions saved:
- by households with solar power
- if the whole class had solar power.
- Students interested in gathering more in depth data about their energy use and greenhouse emissions can use the Carbon Footprint Calculator.
Discussion
Digital Technology focus
- Demonstrate how to create a chart (e.g. bar graph) using spreadsheeting software.
- Discuss ways to compare data and why this is useful.
- What are some useful ways to present data?
Science focus
- What does the data collected tell you about your energy use?
- How does your use of appliances contribute to greenhouse gas emissions?
- Explain your views about reducing greenhouse gas emissions.
Why is this relevant?
Acquire data
Acquire data examines how we collect and access data from a variety of sources.
Students can generate data of various types through their own experiments and investigations.
Store data
Record data in a format that allows it to be easily accessed or obtained. Students can describe how the data they have acquired can be stored in different ways using different representations and/or software, and select the most suitable representation is important.
Organise data
Organise data explores the ways we order, sort and arrange data to assist us with interpretation in different contexts.
Interpret data
Use data and its characteristics, properties and patterns to form a conclusion or derive meaning from it. Students can work with data that requires some simple processing using software. This could be in the form of things such as simple spreadsheet calculations or using data in code. They draw conclusions about the data as a result of this processing.
Resources
- Calculating greenhouse gas emissions – electrical appliances.
- The Carbon Footprint Calculator(carbonpositiveaustralia.org.au)