About this assessment task
Provide students with a dataset represented in two different ways, for example as an image and also as a combination of text and numbers in a table. Ask questions about the data to assess students level of understanding. Teachers use the checklist provided to assess students and record observations.
Year band: 3-4
Achievement StandardDescription
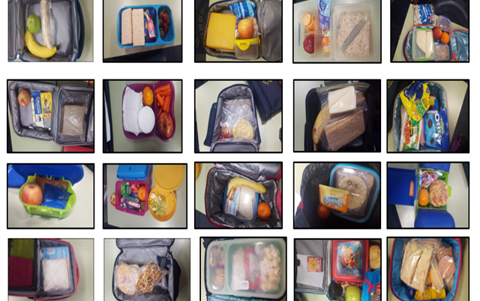
Discuss the types of food that might be found in students’ school lunch boxes.
Students consider the information that can be found using lunch box data.
Introduce the data set image of class lunch box contents. Use the resource Data patterns and representation: Data collection, analysis and presentation to guide the assessment task.
Interpretation of data.
What data can they interpret?
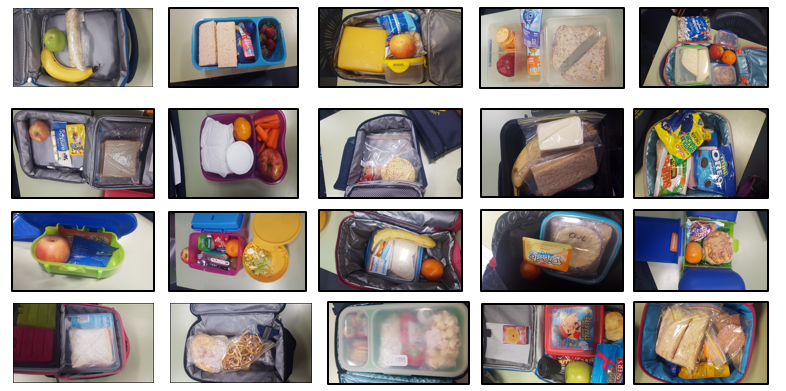
Present the same data in a different way. Interpret the data.
Explain to students that the table only shows the types of fruit.
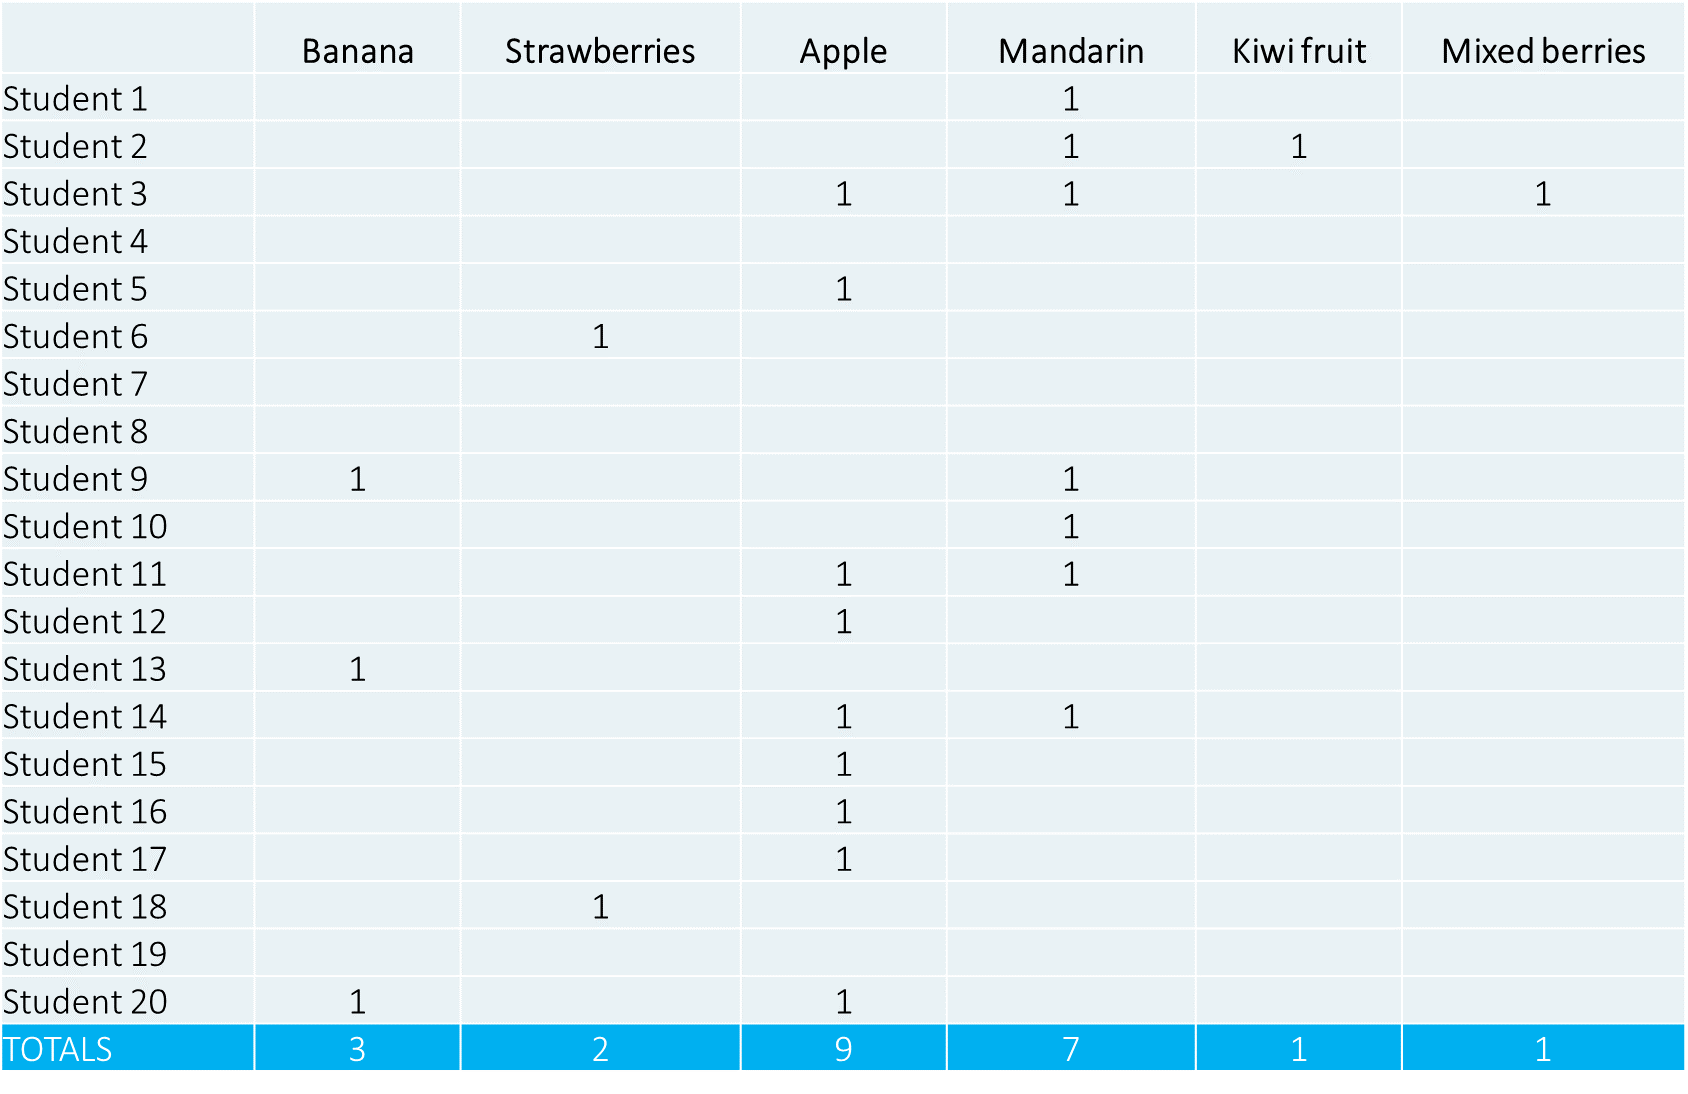
Ask questions to assess students’ understanding
Questions might include:
- What is the most common fruit?
- Why is this fruit more popular? (cost, taste, ease of storage in lunch box, seasonal)
- How many students brought more than one type of fruit in their lunch box?
- How many of the students do not have fruit in their lunch box?
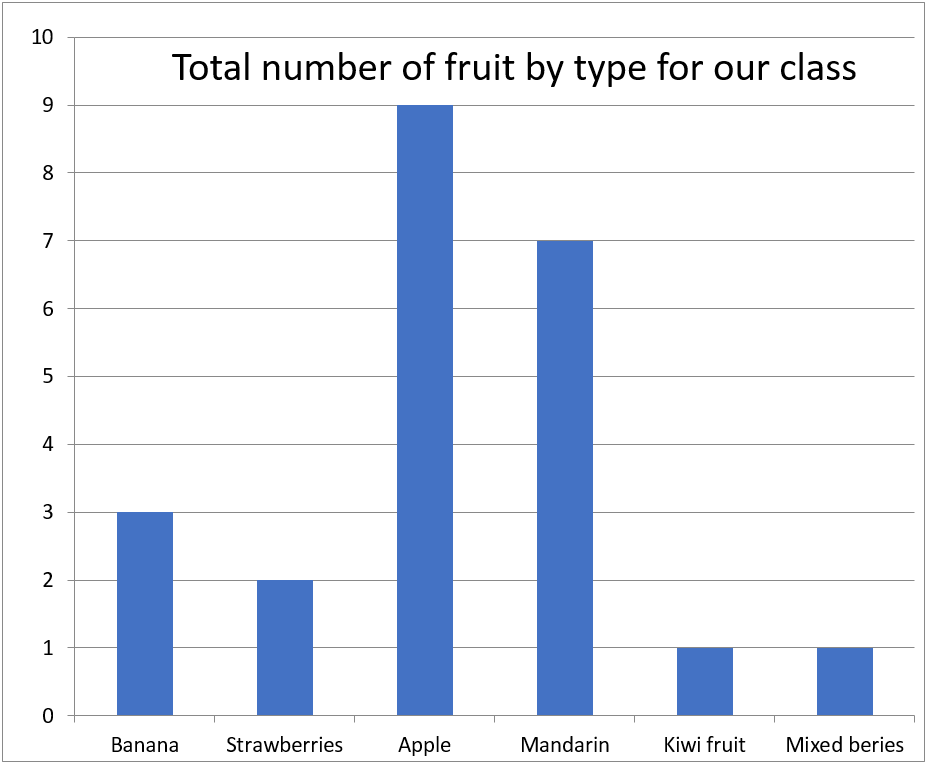
Provide the data represented using images and presented as a picture graph.
Ask students what labels and other additions can be added to make sure it makes sense.
These may include values, title, headings, and a scale on axis.
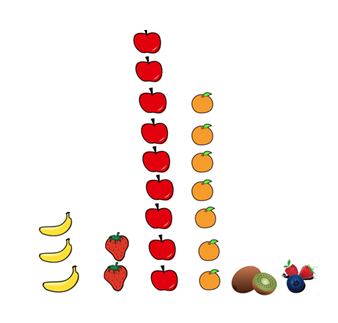
Students create their own chart representing data in a different way for example a column graph using spreadsheeting software.
For example:
Assessment Checklist
This assessment checklist provides a guide to record the student’s demonstrated skills and knowledge.
Word and pdf versions of the checklist can be downloaded in the resources section.
| Demonstrated knowledge/skills | Yes/No or progressing | Comments |
|---|---|---|
|
The student explains how the same data sets can be represented in different ways.
|
||
|
The student can interpret data organised and displayed in different way.
|
||
|
The student can present data using a suitable format
|
Resources
- Yr 3-4 Lunch box data: Assessment checklist (PDF version)
- Yr 3-4 Lunch box data: Assessment checklist (Word version)
- Data patterns and representation: Data collection, analysis and presentation guide (PDF version)
- Data patterns and representation: Data collection, analysis and presentation guide (Word version)