
Pedestrian counting system
The system counts pedestrian movements to give the City of Melbourne a better understanding of how people use the city so we can manage the way they function and plan for future needs. The online visualisation tool is an interactive map of these sensor locations, which enables users to see pedestrian counts on particular dates and times and compare data.
Additional details
| Year band(s) | 7-8, 9-10 |
|---|---|
| Content type | Tools for learning, Student challenges |
| Format | Interactive |
| Core and overarching concepts | Data representation, Data interpretation |
| Australian Curriculum Digital Technologies code(s) |
AC9TDI8P02
Analyse and visualise data using a range of software, including spreadsheets and databases, to draw conclusions and make predictions by identifying trends
AC9TDI10P02
Analyse and visualise data interactively using a range of software, including spreadsheets and databases, to draw conclusions and make predictions by identifying trends and outliers |
| Keywords | Real data, Data representation, Online visualisation tool, Interactive map, Sensors, Location data, Pedestrian statistics, Melbourne city |
| Integrated, cross-curriculum, special needs | HASS |
| Organisation | City of Melbourne |
| Copyright |
Related resources
-
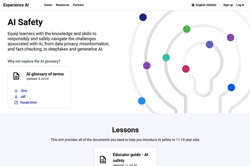
AI Safety
Equip learners with the knowledge and skills to responsibly and safely navigate the challenges associated with AI, from data privacy, misinformation, and fact-checking, to deepfakes and generative AI.
-
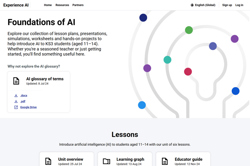
Foundations of AI
Explore our collection of lesson plans, presentations, simulations, worksheets and hands-on projects to help introduce AI to Years 7-8 students.
-

Binary Numbers Magic Trick
This magic trick relies on binary numbers.
-

The Binary Puzzle
This site provides a new online interactive binary puzzle, similar to Sudoku, every day.
-

AI for oceans
Learn about artificial intelligence (AI), machine learning, training data, and bias, while exploring ethical issues and how AI can be used to address world problems.