About this lesson
The lesson follows an inquiry process where students use the dataset to answer relevant questions about the crocodile population. It also provides an opportunity for students to learn about Aboriginal and Torres Strait Islander histories and cultures, and sustainability. It also provides suggestions to be gender-responsive, with Girls in Focus tips.
Year band: 5-6, 7-8
Curriculum Links AssessmentLearning hook
Prior to the 1970s, estuarine crocodiles were hunted extensively for their skins — as a result their number were drastically reduced. After three decades of unregulated hunting, numbers across the Kimberley and the Northern Territory (NT) fell to less than 8000 individuals. Scientists have been collecting data to assess the distribution and abundance of crocodiles to gain an understanding of the extent to which the populations are recovering.
Representing the Traditional owners of north-west Australia, the Kimberley Ranger Network provides the frontline in current management practices in the region. Using a combination of traditional knowledge, Western science and modern technologies to improve marine conservation and management outcomes, the Rangers are tasked with protecting the unique biodiversity values of this beautiful region.
This lesson focuses on the analysis of a dataset that records scientific data collected about the crocodile population in the Kimberley region during 2015. The lesson follows an inquiry process where students use the dataset to answer relevant questions about the crocodile population. It also provides an opportunity for students to learn about Aboriginal and Torres Strait Islander histories and cultures, and sustainability. It also provides suggestions to be gender-responsive, with Girls in Focus tips.
This lesson was created and developed in partnership with Pawsey Supercomputing Centre and Western Australian Marine Science Institution (WAMSI) Kimberley Marine Research Program.
Saltwater crocodile data sourced from Western Australian Marine Science Institution (WAMSI) project funded by Western Australian State Government and research partners. Data licensed under the Creative Commons BY-NC-SA 2.5 AU licence.
Learning intentions
- Use relevant techniques to clean up data (eg remove blank rows)
- Save, store and use CSV files
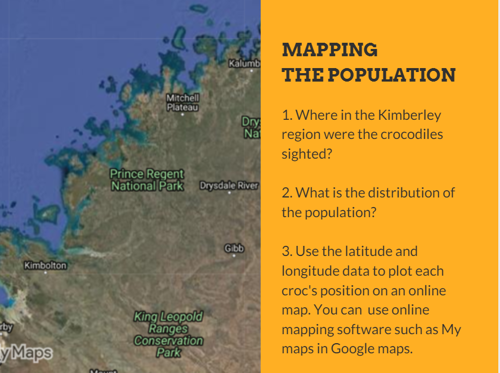
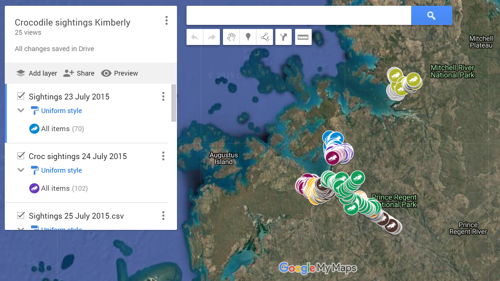
- Visualise data using mapping software such as Google Maps, using latitude and longitude data
- Use spreadsheeting software to sort and filter data to help answer inquiry questions
- Analyse data and look for patterns
- Create graphs such as a bar graph to present data
- Select the most suitable graphing format to visualise and present data
- Use higher order thinking skills (interpreting, analysis, inferring, summarising, evaluating)
- Understand the scientific method used to survey crocodile populations
- Convert between feet and metres (dataset contains metric and imperial measurements)
Suggested steps
Step 1
Use a relevant hook to engage students to discover more about saltwater crocodiles.
- Use a quiz to stimulate interest in saltwater crocodiles and discussion of some key concepts.
- You could introduce a dilemma to encourage students to consider a range of issues and concerns where they need to balance social, ethical, economic, conservation and cultural perspectives. In the student task we have used the dilemma: ‘Should crocodile trophy hunting be permitted in the Kimberley?’

Use the Saltwater crocodile: student task presentation slide deck, which provides a guide to student’s inquiry. Download the PDF and accessible versions here.
To support students use the inquiry questions and sample answers guide.
Girls in Focus:
Research has shown that girls are interested in careers that have a positive social impact. This topic shines a spotlight on a contemporary issue that requires a balance of social, ethical, economic, conservation and cultural perspectives.
Step 2
Briefly discuss students’ knowledge or experiences of crocodiles, in particular about saltwater crocodiles. Discuss the term 'trophy hunting'. What impact may this have on the crocodile population? Discussions may also cover an ecological focus such as crocodile distribution, habitat, feeding habits, behaviours; or a land management focus such as tourism, fishing, boating or human interactions. Give students the opportunity to locate relevant resources or provide resources such as Crocs get it on, Estuarine Crocodile or Saltwater crocodile facts for kids.
Girls in Focus:
Some students may be interested in this emerging industry: Crocodile Industry (see: AgriFutures: Australian Crocodile Industry)
Step 3
Introduce the scientific study conducted to gather data to determine the extent of the recovery of crocodile population numbers, after crocodiles numbers were in decline as a result of unregulated hunting, prior to 1970s. Provide the dataset 'Crocodile data 2015'. Organise students into collaborative teams to investigate the issue and develop their team response.
Girls in Focus:
Research has shown that girls value interaction and collaboration. Promote collaboration and recognition of the varied skills within the team, ensuring that all students are given the opportunity to manipulate the data set.
Step 4
Use relevant video resources to provide a context for the way in which scientists (male and female) collect data that is used in conservation-related decisions.
Girls in Focus:
Research has shown that when girls are exposed to positive STEM role models, their interest increases, along with an improved self-concept related to STEM fields. When showing scientists in action and use of technology, provide a balanced representation of males and females.
Sample answers
Inquiry questions with possible sample answers guide.
A table of results sorted and a count for each length
| Length | Count | Comment |
|---|---|---|
| 1 foot (0.3 m) | 219 | Most common |
| 2 foot (0.61 m) | 22 | |
| 3 foot (0.91 m) | 206 | |
| 4 foot (1.22 m) | 124 | |
| 5 foot (1.52 m) | 199 | |
| 6 foot (1.83 m) | 142 | |
| 7 foot (2.13 m) | 117 | |
| 8 foot (2. 44 m) | 39 | |
| 9 foot (2.74 m) | 25 | |
| 10 foot (3.05 m) | 22 | |
| 11 foot (3.35 m) | 5 | |
| 12 foot (3.66 m) | 6 | |
| 13 foot (3.96 m) | 1 | |
| 14 foot (4.27 m) | 2 | Largest |

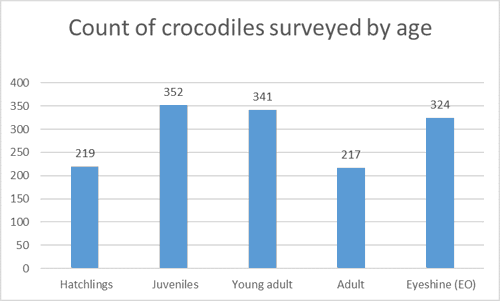
| Age | Size (m) | Count |
|---|---|---|
| Hatchlings | Up to 0.6 m | 219 |
| Juveniles | > 0.6 to 1.5 m | 352 |
| Young adult | > 1.5 to 2.1 m | 341 |
| Adult | > 2.1 m | 217 |
| Eyeshine (EO) | Not visible | 324 |
| TOTAL | 1453 |
Map data © 2019 Google
Map data © 2019 Google
Map should show data for both Prince Regent River and Roe Hunter Rivers systems.
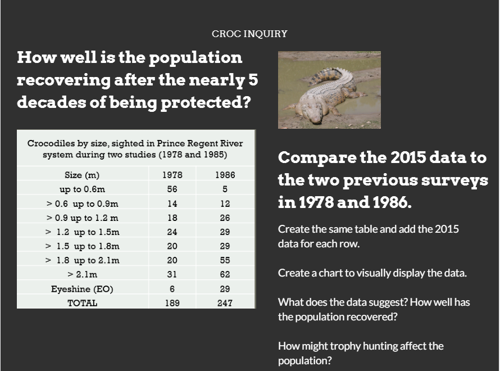
Crocodiles by size, sighted in Prince Regent River system during three studies (1978, 1985 and 2015).
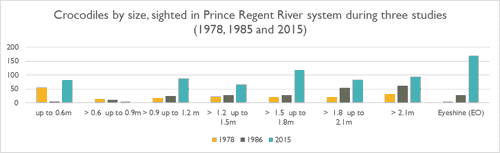
| Size (m) | 1978 | 1986 | 2015 |
|---|---|---|---|
| up to 0.6m | 56 | 5 | 82 |
| 0.6 up to 0.9 m | 14 | 12 | 6 |
| 0.9 up to 1.2 m | 18 | 26 | 88 |
| 1.2 up to 1.5 m | 24 | 29 | 67 |
| 1.5 up to 1.8 m | 20 | 29 | 118 |
| 1.8 up to 2.1 m | 20 | 55 | 84 |
| 2.1 m | 31 | 62 | 94 |
| Eyeshine (EO) | 6 | 29 | 169 |
| TOTAL | 189 | 247 | 708 |
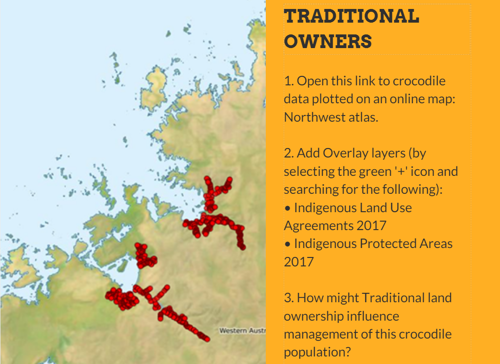
Encourage students to recognise that there is overlap of crocodile data points and shaded areas on the Indigenous Land Use Agreements 2017 and Indigenous Protected Areas 2017 maps. This indicates that the Traditional land owners are a significant stakeholder and must be part of any discussions and proposed management strategy.

Indigenous Land Use Agreements 2017
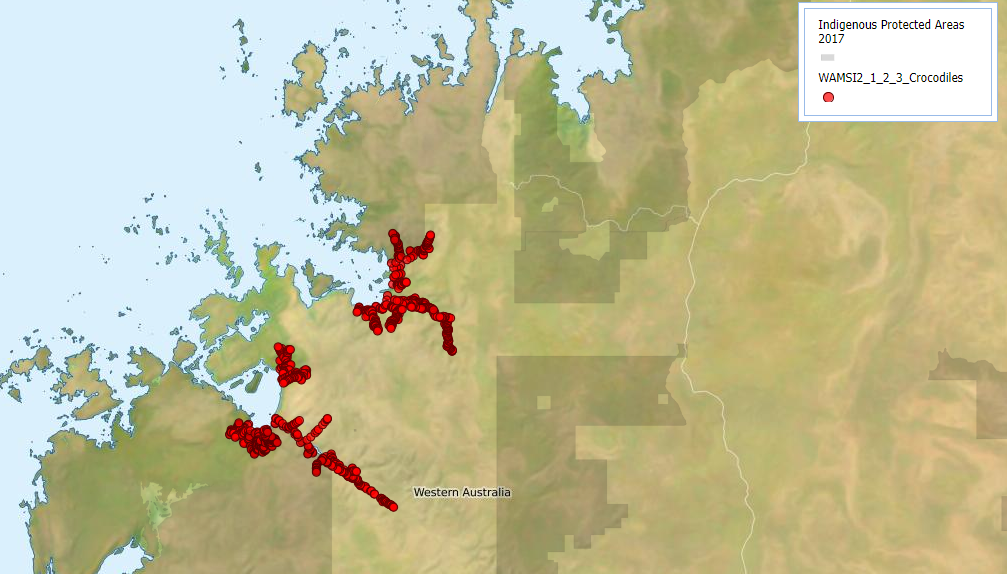
Indigenous Protected Areas 2017
Discussion
Digital Technology focus
- How is GPS and other technology used in collecting data about crocodile populations? What are the benefits of these types of technology?
GPS enables researchers to plot an accurate location for each individual crocodile. Digital systems such as laptop, tablet or similar with a data entry app enable immediate data entry and uploading of data using cloud technology for sharing and collaboration.
- How is GPS data (longitude and latitude) useful when analysing and visualising fauna data?
Location data (longitude and latitude) enables accurate plotting of animal location on a map using mapping software.
- In what ways can you use a spreadsheet to analyse data?
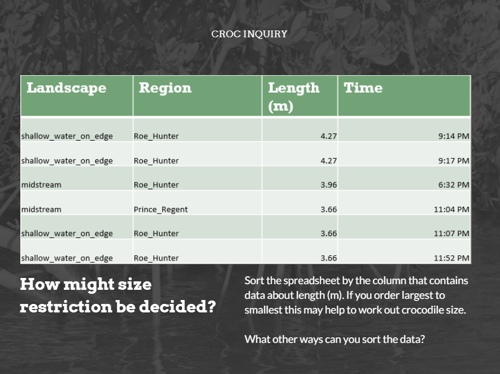
Once the data is cleaned up, it can be sorted and filtered according to the question being answered. Typically the data is sorted by columns based on the cell’s value or text. Sorting allows for grouping entries by a common attribute, which helps identify patterns or trends in data.
- How do you decide on the most effective mode to present data?
Discrete or continuous data.
Science focus
- What factors affect the wild crocodile populations?
Eggs may not survive to hatching due to predation of goannas and feral pigs or issues to do with the eggs themselves or nesting site conditions. Hatchlings are often taken by predators before they mature. Smaller crocodiles may be attacked by larger crocodiles. Many crocodiles are still killed accidently in fishing nets. Some eggs and crocodiles are taken from the wild for commercial crocodile farms. Occasionally crocodiles are removed from an area.
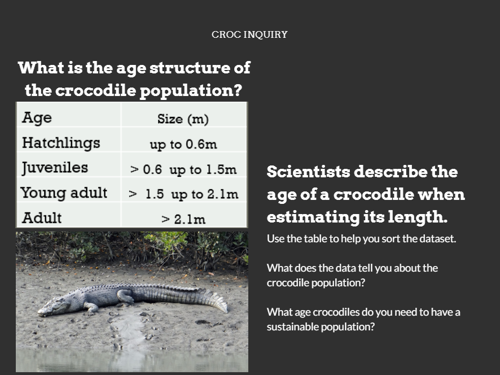
- Data: Saltwater crocodile size usually ranges from 0.3 to 5.4 m. Croc length is estimated using intervals of 30 cm. What can we deduce from the length of the crocodile?
The length of the animal is proportional to its age. Crocodiles measuring < 0.6 m are considered hatchlings of that year. Juvenile crocodiles are > 0.6 to < 1.5 m. A 1.5–2 m crocodile is considered a young adult. Crocodiles larger than 2 m are considered adult.
- How is the data collected? How do the scientists ensure that the crocodile data is reliable and does not contain multiple records of the same crocodile?
Surveys are conducted by boat travelling upstream at night when most crocs are on shore or relatively stationary. Based on the speed of the vessel, direction of travel and that it’s at night time, it’s unlikely crocs would be moving around and past the vessel to be counted again (though not impossible).
- How would you design the scientific method to collect the data?
Consider the available and emerging technology, safety, staff required and skills, ethical collection techniques and links to historical data.
- Data is available from previous scientific studies (1978, 1986). Why would it be useful to follow the same surveying methodology and approach?
To ensure meaningful comparisons can be made from historical data, it is important that the same methodology be used and consistent data is collected using the same parameters.
Why is this relevant?
Acquire data
Acquire data examines how we collect and access data from a variety of sources.
Students can generate data of various types through their own experiments and investigations.
Store data
Record data in a format that allows it to be easily accessed or obtained. Students can describe how the data they have acquired can be stored in different ways using different representations and/or software, and select the most suitable representation is important.
Organise data
Organise data explores the ways we order, sort and arrange data to assist us with interpretation in different contexts.
Interpret data
Use data and its characteristics, properties and patterns to form a conclusion or derive meaning from it. Students can work with data that requires some simple processing using software. This could be in the form of things such as simple spreadsheet calculations or using data in code. They draw conclusions about the data as a result of this processing.
Resources
- Crocodile data 2015
- Data for online mapping: spatial data that can be imported into online mapping software (.csv).
- Croc data organised into tabs: a full dataset that can be analysed which has been organised by tabs to enable differentiation (.xlsx).
- Croc survey tool: a spreadsheet that can be used to model survey collection and use the data to create charts/graphs (.xlsx).
- Saltwater crocodile: student task presentation slide deck
- Saltwater crocodile: student task presentation slide deck (accessible version)
- Croc quiz
Crocodile information
- Saltwater crocodiles: WAMSI Project information: distribution, abundance, critical habitat and population growth rates of saltwater crocodile populations in the Kimberley region. Includes fact sheet and video that explains scientific sampling of crocodiles.
- Crocs get it on: An ABC News article about saltwater crocodiles which provides useful background information.
- Estuarine Crocodile: An Australian Museum article about saltwater crocodiles which provides useful background information.
- Maniac, Aggro and One-Eyed Willie — meet the biggest, baddest crocs of the Kimberley
- Dozens of saltwater crocodiles so dangerous they've been plucked from the wild to live out their days at Western Australia's only crocodile park.
Crocodile data and mapping
- Refer to the crocodile data displayed in the North West Atlas.
Video tutorials
References
Australian Curriculum, Assessment and Reporting Authority (ACARA) 2016, Cross-curriculum priorities
Fukuda et al. 2011, Recovery of saltwater crocodiles following unregulated hunting in tidal rivers of the Northern Territory, Australia, Journal of Wildlife Management 75 (6), 1253–1266
Fukuda et al 2012, 'Standardised method of spotlight surveys for crocodiles in the tidal rivers of the Northern Territory, Australia', 24 (1), 14–32
Halford, A, Barrow, D 2017, ‘Saltwater crocodiles (Crocodylus porosus) in the northwest Kimberley’, WAMSI Kimberley Marine Research Program Report, Project 1.2.3, Western Australian Marine Science Institution
WAMSI 2017, ‘Saltwater crocodile populations continue to grow in Prince Regent River’
WAMSI 2 – Kimberley Node – 1.2.3 2017–18, ‘Distribution, abundance, critical habitat and population growth rates of saltwater crocodile populations in the Kimberley region’ (Metadata for Halford, and Barrow article above)