
Weather data representation
In this lesson, students explore various ways to share ideas and information, including using pictures, words and symbols. They also learn about First Nations perspectives on weather, represent weather data, and compare different representations of weather symbols.
Additional details
| Year band(s) | 1-2 |
|---|---|
| Content type | Lesson ideas |
| Format | Web page |
| Core and overarching concepts | Data representation, Abstraction |
| Australian Curriculum Digital Technologies code(s) |
AC9TDI2K02
Represent data as pictures, symbols, numbers and words |
| Keywords | weather, symbols, seasons, First Nations Australian, Country/Place, Indigenous weather knowledge , Tania Taylor |
| Integrated, cross-curriculum, special needs | Mathematics, HASS, Aboriginal and Torres Strait Islander Histories and Cultures |
| Organisation | ESA |
| Copyright | These resources may be used under a Creative Commons Attribution-Non Commercial-No Derivatives (CC BY-NC-ND 4.0) licence. These resources were created by Tania Taylor and Kim Martin. |
Related resources
-

Computational thinking in practice F-2 (Parent and teacher activity cards)
A set of printable cards that give simple activity ideas for parents and teachers on each of the six aspects of computational thinking.
-
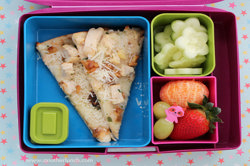
Acquiring data and representation: What’s in your lunchbox?
The type of fruits and vegetables in school lunchboxes or those eaten at crunch and sip or fruit break time can provide a good source of data for a classroom investigation.
-
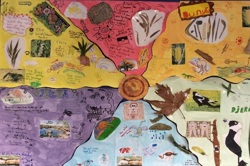
Classroom ideas F-10: Aboriginal and Torres Strait Islander connections to Digital Technologies
This resource provides examples of ways Aboriginal and Torres Strait Islander Histories and Cultures can be integrated into Digital Technologies. Examples include 'classification and sorting data' and 'designing solutions'.
-

Understanding algorithms and the smiley face biscuit challenge (Years F-2)
Algorithms are a key concept in Digital Technologies. They help us follow, describe and represent a sequence of steps and decisions needed to solve problems.
-
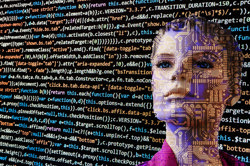
Robots, data and computational thinking (Years 2-4)
This classroom resource comprises four worksheets to accompany a lesson on data and computational thinking. These materials are designed for teachers to use simple line-following robots (Ozobots) to engage students in the computational thinking process and working with data.
-
Data interpretation: organise data by classifying, grouping and sorting objects
To sort and classify familiar objects, students use computational thinking skills to organise data in a logical way.
-
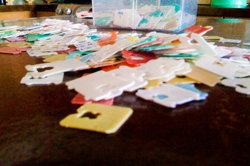
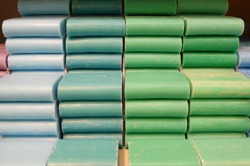
Exploring patterns and data with bread tags and plastic lids (Years 1-2)
In Digital Technologies, manipulatives/ concrete materials/ loose parts such as bread tags and lids can be used to learn more about data.
-
Data representation
Ideas for teaching about patterns in data, representing data as pictures, symbols and diagrams as well as ideas for teaching about collecting, sorting and using digital systems to present data.