
CS Unplugged: Image Representation - Colour by Numbers
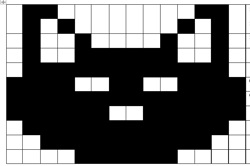
Use the Colour by Numbers offline activity to explore how a B&W image is made up of pixels, shown as black or white dots which are represented by either a 1 or 0. Using a 0 or 1 to represent a white or black square students create an image on a grid. They supply the coded message for someone else to recreate. Support your teaching and learning with video clips and other related resources.
Additional details
| Year band(s) | 5-6 |
|---|---|
| Format | Web page |
| Core and overarching concepts | Data representation |
| Australian Curriculum Digital Technologies code(s) |
AC9TDI6K04
Explore how data can be represented by off and on states (zeros and ones in binary) |
| Keywords | Data representation, Image Representation, Pixels, Binary |
| Organisation | University of Canterbury, New Zealand |
| Copyright | Creative Commons BY-NC-SA 4.0 |
Related resources
-
Classroom ideas F-10: Aboriginal and Torres Strait Islander connections to Digital Technologies
This resource provides examples of ways Aboriginal and Torres Strait Islander Histories and Cultures can be integrated into Digital Technologies. Examples include 'classification and sorting data' and 'designing solutions'.
-

Apple vs tomato
Train a machine learning model to detect if you are holding an apple or a tomato. Then, improve the classifier by using more diverse training data.
-

What are binary numbers? - James May's Q&A (Ep 11100) - Head Squeeze
Binary Numbers are explained in this video by Top Gear's James May.
-
Using binary to create on/off pictures
In this sequence of lessons students develop an understanding of how computers store and send digital images and they are able to represent images in a digital format.
-

Class blog
In this lesson sequence students investigate features of a good blog focusing on such things as the concept, purpose, audience and critical features.
-
Introduction to binary
This sequence of lessons focuses on what a binary number is, what a decimal number is, why binary numbers are important in digital systems and how to read and understand a binary number.
-

Binary Numbers Magic Trick
This magic trick relies on binary numbers.